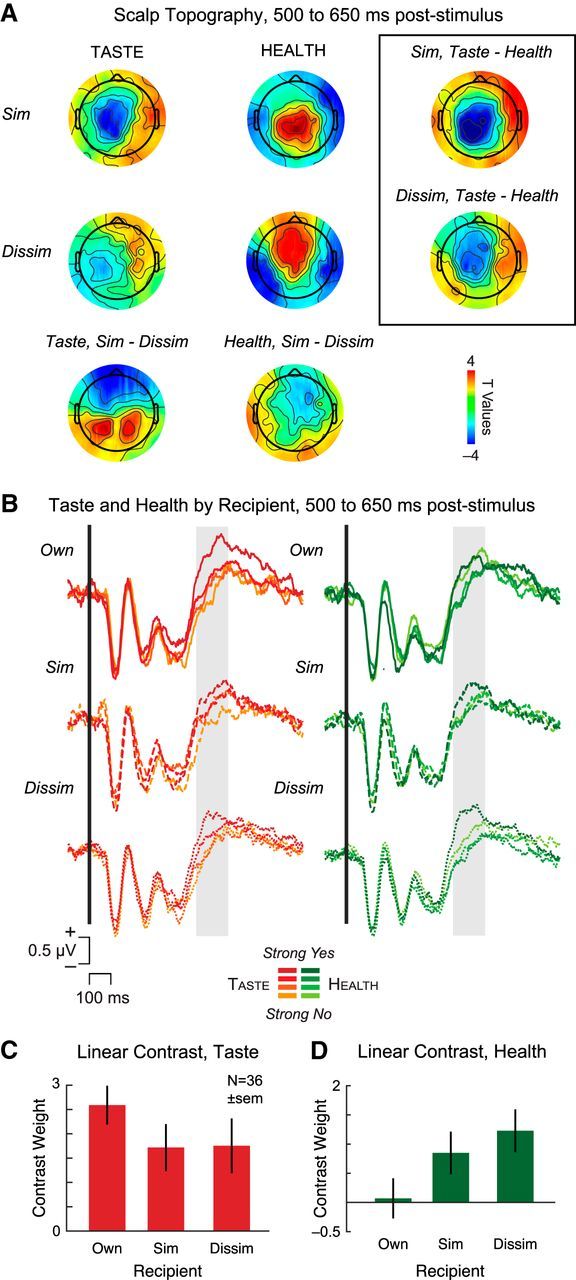
Figure 4.

ERP analysis of attribute-weighting by recipient. A, Scalp topography during time WOI from 500 to 650 ms after stimulus revealed differences in neural weighting of taste ratings (left) and health ratings (middle) by recipient. SOIs were identified by taking the conjunction of sensors showing significant ERP activity for Similar and Dissimilar in the Taste versus Health comparison (black box, right). B, Average waveforms associated with the linear ordering of taste (left) and health (right) plotted separately for each recipient. Solid line indicates Own. Dashed line indicates Similar. Dotted line indicates Dissimilar. Orange represents taste. Green represents health. C, D, Linear contrast weights for taste (C) and health (D) as a function of recipient.
