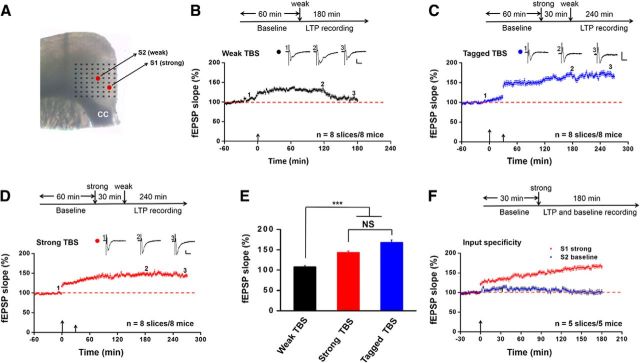
Figure 1.
Synaptic tagging occurs in the adult mouse ACC. A, Light microscopy photograph showing the location of the MED64 probe relative to one ACC slice. We applied electrical stimulation separately to two distinct inputs as shown by the two red dots in the picture. The S1 stimulation site received strong TBS in the superficial layer, whereas the S2 site was given a weak TBS in the deep layer of ACC (see Materials and Methods for the details of the protocols). CC, Corpus callosum. B, Summarized plot of the fEPSP slope demonstrates the induction of E-LTP by weak TBS alone that gradually decayed to the baseline within 3 h. C, Summarized plot of the fEPSP slope demonstrates the induction of L-LTP by weak TBS if preceded, 30 min earlier, by a strong TBS (i.e., tagged TBS). Tagged TBS-evoked L-LTP lasts for at least 4 h. D, Summarized plot of the fEPSP slope shows the induction of persistent L-LTP by strong TBS alone that lasts for 4.5 h. E, Bar histogram showing quantified data within last 10 min of the LTP recording for weak TBS alone, strong TBS alone, and tagged TBS. The magnitude of tagged TBS-induced L-LTP did not differ from that of strong TBS alone. F, Pooled data showing that delivery of strong TBS onto S1 pathway had no effect on the baseline responses in another S2 pathway. B–D, F, Schematic diagram of the recording procedure for each experiment is shown at the top of the plot. Insets, Representative fEPSP traces taken at the time points indicated by numbers in the graph. Calibration: 100 μV, 10 ms. Large arrows indicate starting point of strong TBS application; small arrows mark the time point of weak TBS delivery. ***p < 0.001 versus weak TBS. NS, No significance. Error bars represent SEM.

