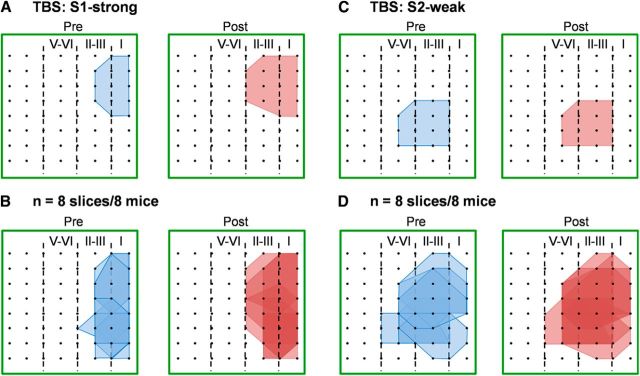
Figure 3.
No recruitment of new responses after synaptic tagging in the ACC. A, Polygonal diagrams of the channels that were activated in the baseline state (blue, pre) and at 4.5 h after strong TBS of the S1 site (red, post) in one slice. Black dots represent the 64 channels in the MED64 system. Vertical lines indicate the layers in the ACC slice. B, Pooled data of eight slices from eight mice for the spatial analysis performed as in A. C, Polygonal diagrams of the channels that were activated in the baseline state (blue, pre) and at 4 h after weak TBS (preceded by strong TBS, i.e., tagged TBS, red, post) in one slice. D, Pooled data of eight slices from eight mice for the spatial analysis performed as in C. Delivery of strong TBS resulted in an enlargement of the activation area, whereas tagged TBS did not recruit new synaptic responses in the ACC.

