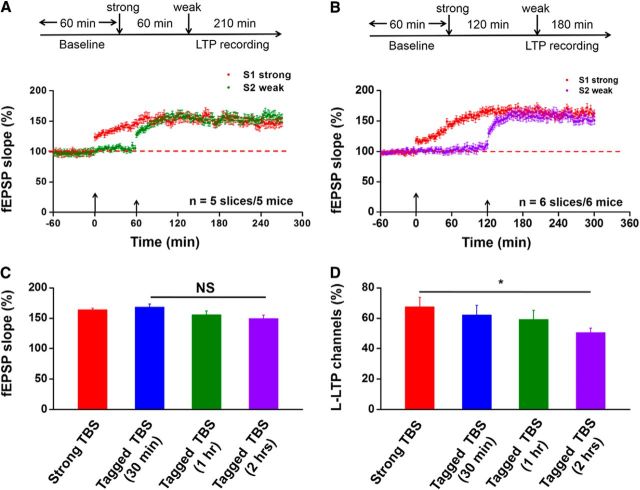
Figure 4.
Time window of synaptic tagging in the ACC. A, Top, Schematic diagram of the recording procedure. We applied the weak TBS protocol to the S2 site at 1 h after strong TBS of the S1 site (tagged TBS, 1 h). Bottom, Pooled data showed that both strong TBS at S1 site and weak TBS at S2 site could induce L-LTP (n = 5 slices/5 mice). B, Top, schematic diagram of the recording procedure. The weak TBS protocol was applied to the S2 site at 2 h after strong TBS of the S1 site (tagged TBS, 2 h). Bottom, Pooled data showed that weak TBS could still benefit from the strong TBS by inducing sustained L-LTP (n = 6 slices/6 mice). C, Bar histogram summarizing quantified data within last 10 min of the L-LTP recording for strong TBS, tagged TBS 30 min, tagged TBS 1 h, and tagged TBS 2 h. NS, No significance. D, Percentage of L-LTP-showing channels among the four groups. Although L-LTP could still be generally induced by weak TBS, the percentage of channels that undergo L-LTP was clearly decreased with 2 h interval. *p < 0.05 versus strong TBS. NS, No significance. Large arrows in A and B indicate starting point of strong TBS application; small arrows mark the time point of weak TBS delivery. Error bars represent SEM.

