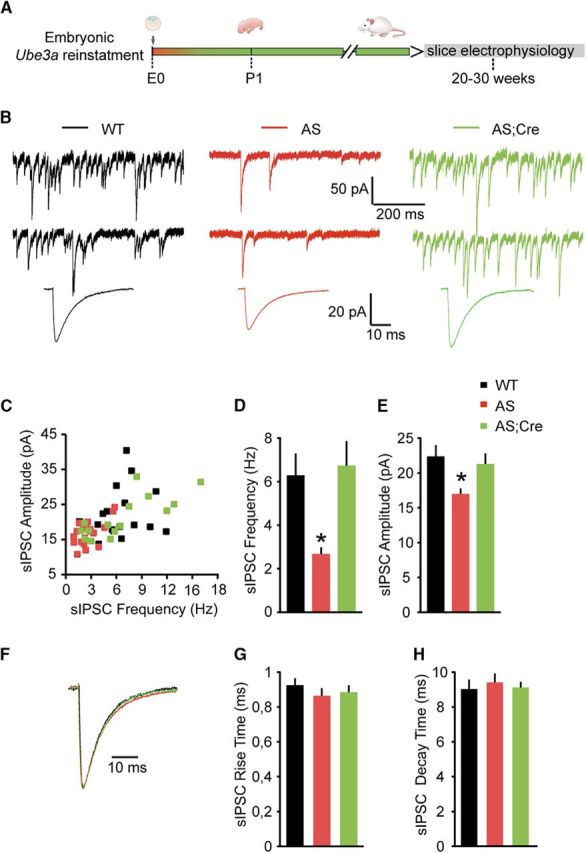
Figure 1.

Embryonic reactivation of Ube3a expression rescues the spontaneous inhibitory neurotransmission in pyramidal neurons (PN) from mouse layer 5 PFC. A, Schematic representation of Ube3a reactivation during mouse embryonic development and time point of electrophysiological recordings. B, Top, Representative voltage-clamp recordings of sIPSCs from layer 5 PN obtained by clamping the neurons at −70 mV, in the presence of CNQX (10 μm), in Ube3amStop/p+ and WT littermates crossed with an embryonically active Cre line. Bottom, Average sIPSCs obtained by averaging at least 100 nonoverlapping individual events. AS mice show a clear decrease in both sIPSC frequency (B, top) and amplitude (B), which can be rescued by embryonic reactivation of the Ube3a gene in the AS;Cre mice. C, Raster plot of all the cells included in the analysis. Each dot indicates one cell, showing the amplitude of averaged sIPSCs and the sIPSC frequency. D, E, Average data representing mean ± SE, for sIPSC frequency and amplitude, respectively, in layer 5 PN. Number of neurons included in each group: WT, N = 18 neurons/6 mice; AS, N = 20 neurons/6 mice; AS;Cre, N = 17 neurons/6 mice. A one-way ANOVA shows a significant effect of the genotype on both frequency (F(2,52) = 9.182, p = 0.0001) and amplitude (F(2,52) = 5.63, p = 0.006). Post hoc Bonferroni: AS against WT (p = 0.002 for frequency, and p = 0.012 for amplitude), AS against AS;Cre (p = 0.002 for frequency, and p = 0.028 for amplitude), and WT against AS;Cre (p = 1 for frequency, and p = 1 for amplitude). F, Examples of scaled averaged sIPSCs from B (bottom), pointing to no changes in kinetic properties. G, H, Average data representing mean ± SE, for sIPSC 10–90 rise time and decay time, respectively, in layer 5 PN. No significant effect of genotype on either rise time (F(2,52) = 0.76, p = 0.4) or decay time (F(2,52) = 0.21, p = 0.8) is observed (one-way ANOVA). *indicates statistically significant differences for p < 0.05.
