Figure 2.

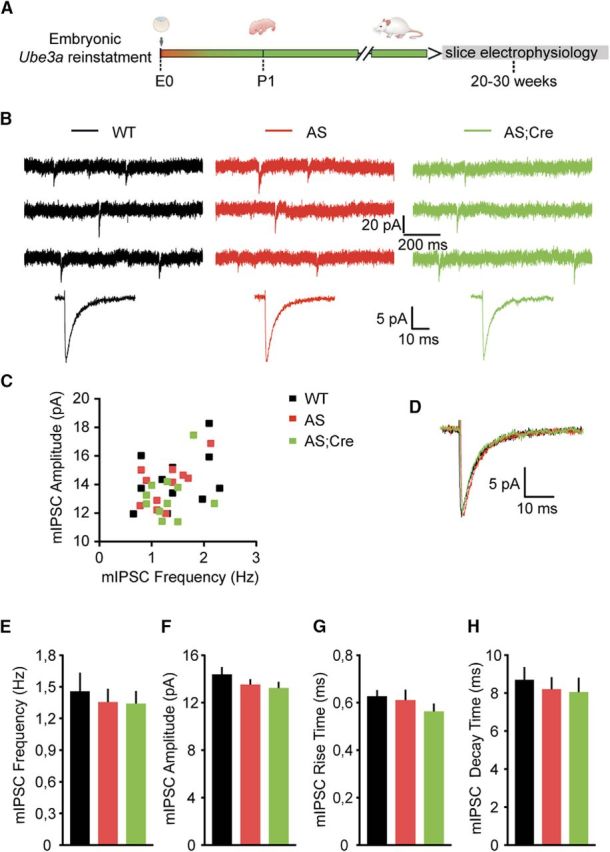
Loss of Ube3a expression does not affect the miniature inhibitory neurotransmission of pyramidal neurons from mouse mPFC. A, Schematic representation of Ube3a reactivation during mouse embryonic development and time point of electrophysiological recordings. B, Top, Representative voltage-clamp recordings of mIPSCs from layer 5 PN obtained by clamping the neurons at −70 mV, in the presence of CNQX (10 μm) and TTX (1 μm), in AS and WT littermates crossed with an embryonically active Cre line. Bottom, Average mIPSCs obtained by averaging at least 100 nonoverlapping individual events. No difference for any of the measured parameters is observed between groups. C, Raster plot of all the cells included in the analysis. Each dot indicates one cell, showing the amplitude of averaged mIPSCs and the mIPSC frequency. D, Overlapping averaged mIPSCs from B. Bottom, No changes in amplitude or kinetic properties. E–H, Average data representing mean ± SE, for mIPSC frequency, amplitude, rise and decay time constant, in layer 5 PN. Number of neurons included in each group: WT, N = 11 neurons/3 mice; AS, N = 11 neurons/3 mice; AS;Cre, N = 11 neurons/3 mice. No significant effect of genotype on frequency (F(2,30) = 0.36, p = 0.7), amplitude (F(2,30) = 1.19, p = 0.3), rise time (F(2,30) = 1.4, p = 0.2), or decay time (F(2,30) = 0.29, p = 0.74) is observed (one-way ANOVA).
