
Figure 1.
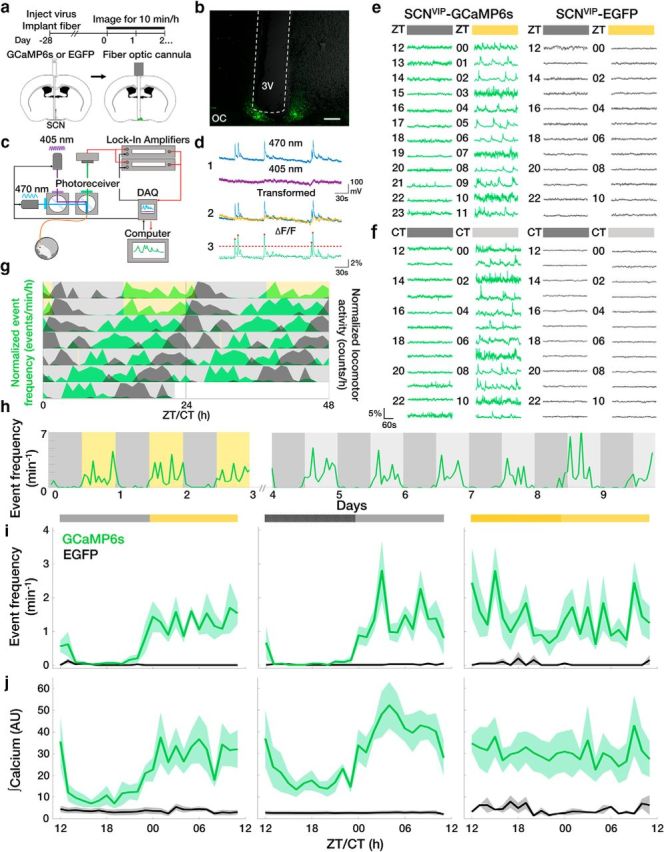
SCN VIP neurons exhibit daily rhythms in spontaneous calcium activity in vivo. a, Fiber photometry experimental timeline and schematic. b, Representative image of a fiber-optic cannula (white dashed lines) positioned above a GCaMP6s+ SCN. OC, Optic chiasm; 3V, third ventricle. Scale bar, 200 μm. c, Schematic of the two-color excitation system used to measure calcium-evoked (470 nm) or calcium-independent (405 nm) fluorescence. d, Illustration of calcium event detection. Blue, Raw 470 nm signal; purple, raw 405 nm signal; yellow, detrended 405 nm signal; green, ΔF/F; dashed line, event threshold value; red circles, events. e, f, Hourly ΔF/F traces taken from VIP neurons in transgenic mice with (GCaMP6s) or without (EGFP) a fluorescent calcium reporter in a daily LD cycle (yellow = light phase) or DD (light gray = subjective day). g, Double-plotted actogram of normalized event frequency per hour (green) and normalized locomotor activity counts per hour (black) recorded from an individual GCaMP6s+ mouse housed in LD (gray and yellow shading) and DD (gray shading). A 10 min light pulse (yellow) was given at CT 0 on day 5. h, Long-term recordings revealed reliable daily rhythms in the rate of VIP neuron calcium events from a representative GCaMP6s+ mouse in LD and DD. i, j, The average daily profile of VIP neuron calcium event frequencies and integrated calcium levels depended on circadian time and the presence of light in LD, DD, or LL (light yellow = subjective day) in GCaMP6s (green; n = 5, 5, 4 mice; JTK cycle, p < 0.001), but not EGFP (black; n = 5, 4, 2; JTK cycle, p > 0.05) mice. Light during subjective night in LL increased event frequency compared with DD or LD (two-way ANOVA: F(2,330) = 19.48, p < 0.001; with post hoc Tukey's MCT). Lines and shadings depict the mean ± SEM.