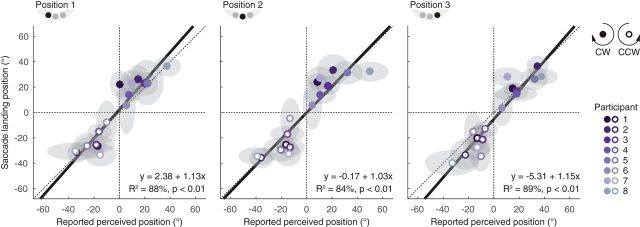
Figure 3.
Target shifts for both Perception and Saccade blocks. Each circle denotes an individual observer's mean ± SEM. Filled circles indicate clockwise reversals, whereas open circles indicate counter-clockwise reversals. Equality lines are plotted as dotted lines. The black line shows a linear best-fit function.

