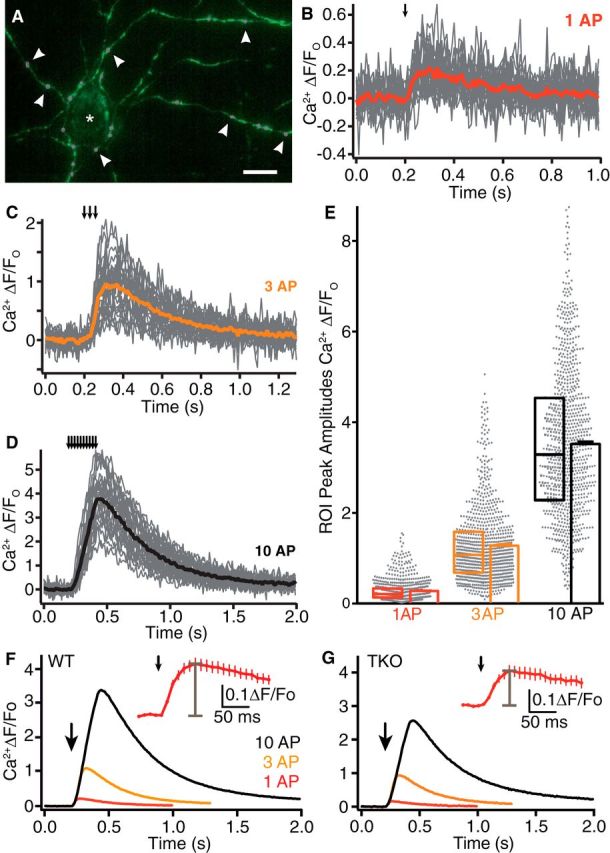
Figure 1.

Monitoring presynaptic Ca2+ influx with synGCaMP6f. A, Axonal branches and putative presynaptic boutons in a hippocampal culture transfected with synGCaMP6f (green) during a stimulation with 10 AP. ROIs were drawn around synaptic boutons (circles, magenta, some are indicated by arrowheads) for evaluation of presynaptic Ca2+ transients. Asterisk, nontransfected neuron. Scale bar, 20 μm. B, Exemplary experiment of fluorescence changes to stimulation by a single action potential (1 AP; arrow indicates stimulation) in a recording from WT neurons transfected with synGCaMP6f; recordings of individual ROIs (gray lines), and averaged response (red line). C, Exemplary fluorescence changes as in B to stimulation by a train of 3 AP (averaged response, orange). D, Exemplary fluorescence changes as in B to stimulation by a train of 10 AP (averaged response, black). E, Maxima of all ROIs from WT neurons corresponding to single synaptic boutons (n = 887 from 35 independent experiments; scatter diagram, gray dots). Overlaid box plots represent median and 25–75% percentiles; bar diagrams show average of ROI maxima (mean ± SEM), colors as in B–D). Note that the mean of ROI maxima is not identical to the maximum of averaged traces due to noise of individual ROI traces and different time points of maxima. F, Traces of Ca2+ fluorescence changes determined by transfected synGCaMP6f from WT neurons averaged across 887 boutons (35 experiments) in response to 1 (red), 3 (yellow), and 10 (black) APs (arrow: start of stimulation train). Inset, The initial response to single AP on an enlarged time scale, gray bar indicates peak amplitude. The recording frequency (100 Hz) is adequate for determination of the peak of the synGCaMP6f fluorescence signal. G, Fluorescence changes of boutons as in F from neurons lacking αNrxns (TKO, n = 750/28).
