Figure 10.

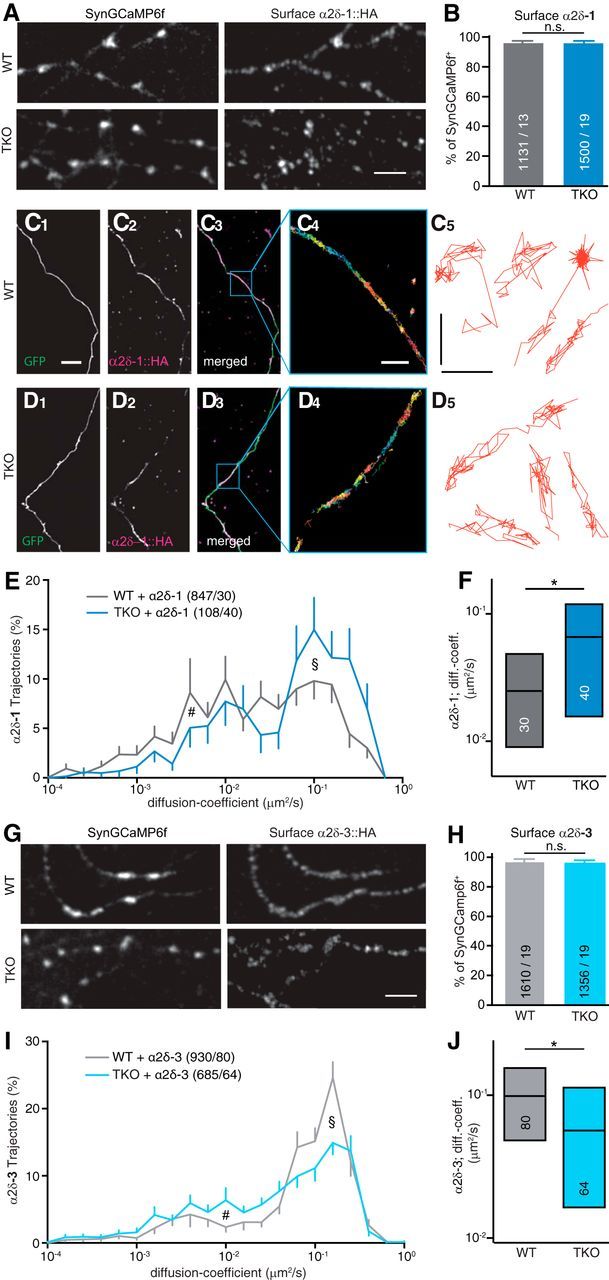
αNrxn modulates surface mobility of α2δ-1 and α2δ-3 auxiliary subunits differentially. A, Representative immunofluorescent images of surface α2δ-1 enriched in synaptic boutons, visualized by an antibody against the HA moiety of α2δ-1::HA cotransfected with synGCaMP6f into WT neurons (top) or TKO neurons (bottom). Scale bar, 5 μm. B, Quantification of colocalization between synGCaMP6f and surface α2δ-1-positive puncta in WT and TKO. Data are mean ± SEM; n = synGCaMP6f-positive puncta/neurons from three to four independent experiments per condition; n.s. = not significant (p = 0.433) by unpaired t test. C, Labeling of the surface population of HA-tagged α2δ-1 (C1) transfected into WT neurons using an antibody specific to the HA moiety. EGFP was cotransfected to visualize neurites (C2), merged images (C3) and an overlay of all trajectories of QD-tracked single α2δ-1 molecules in a subfield as indicated (C4); sample trajectories of QD-tracked single α2δ-1 molecules (C5). Scale bars: C1–D3, 10 μm; C4, D4, 2 μm; C5, D5, 0.5 μm. D, Labeling of surface α2δ-1 as in C using TKO neurons. E, Logarithmic distribution of diffusion coefficients for α2δ-1 on axons of WT and TKO neurons, showing more trajectories of higher mobility in TKO (see §) and fewer low mobility trajectories (see #); n = trajectories/cells; error bars (SEM) shown only in outward direction. F, Median and IQR (25–75%) of diffusion coefficients of α2δ-1 shown in E. Numbers of cells from four independent experiments (in bars). *p = 0.0277, by Kruskal–Wallis test with Dunn's post-test. G, Immunofluorescent images of surface α2δ-3 in synaptic boutons as in A. Scale bar, 5 μm. H, Quantification of colocalization between synGCaMP6f and surface α2δ-3-positive puncta in WT and TKO. Data are mean ± SEM. n = synGCaMP6f-positive puncta/neurons from three to four independent experiments per condition; n.s. = not significant (p = 0.4835), by unpaired t test. I, Logarithmic distribution of diffusion coefficients as in E but for α2δ-3. With α2δ-3, more trajectories of higher mobility occurred in WT (see §), indicating a reverse effect when compared with α2δ-1 (E). J, Median and IQR (25–75%) of diffusion coefficients of α2δ-3 shown in I. Numbers of cells from four independent experiments (in bars). *p = 0.0347, by Kruskal–Wallis test with Dunn's post-test.
