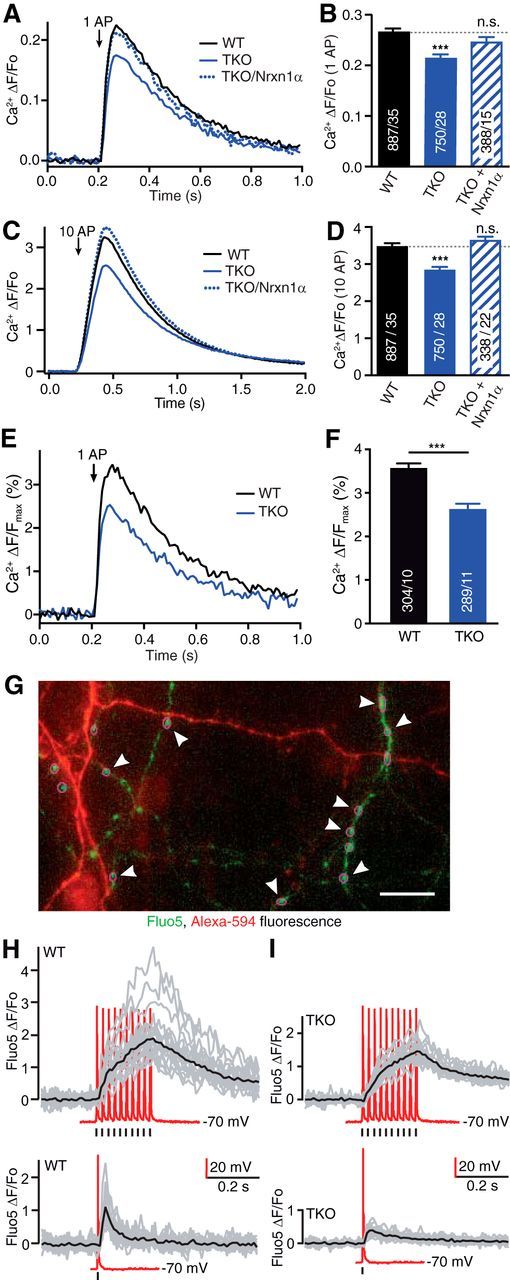
Figure 2.

α-Neurexins are required for normal presynaptic Ca2+ influx in primary hippocampal neurons. A, Comparison of averaged presynaptic Ca2+ traces (n given in corresponding bars in B) from single AP responses of WT, TKO and TKO transfected with Nrxn1α. B, Summary of mean peak synGCaMP6f signals (ΔF/Fo) of Ca2+ transients after single AP stimulation of WT boutons compared with TKO, and TKO transfected with Nrxn1α. Data are mean ± SEM n = ROIs/neurons (in bars), differences to WT are indicated (dotted line); ***p < 0.001; n.s. not significant, p = 0.221; one-way ANOVA, F(2,2040) = 14.6. C, Comparison of presynaptic Ca2+ traces as in A using 10 AP trains for stimulation. Arrow indicates start of stimulation train. D, Analysis as in B with stimulation by 10 AP trains; ***p < 0.001; n.s. not significant, p = 0.182; one-way ANOVA, F(2,2040) = 51.3. E, Traces from WT neurons and from neurons lacking all αNrxns (TKO) that were stimulated with 1 AP (arrow) and normalized offline to the maximal synGCaMP6f fluorescence, as measured by saturating internal Ca2+ after application of the Ca2+-ionophore ionomycin (10 μm) at the end of each recording. F, For each ROI, the maximum of a Ca2+ transient induced by 1 AP was compared with the maximal fluorescence seen in presence of ionomycin. Data are mean ± SEM; n = number of ROIs/neurons, shown in bars. ***p < 0.001 by unpaired t test, t(587) = 5.37. G, Fluorescence image of neurites from WT hippocampal neurons loaded with Fluo5 (green) and AlexaFluor 568 (red) in a combined patch-clamp and imaging experiment. Magenta circles (some are highlighted by arrowheads) indicate ROIs around putative presynaptic boutons. Scale bar, 20 μm. H, Fluorescence changes of Fluo5 recorded from individual WT synaptic boutons (gray lines) and their averaged response (black) to 10 AP (top) or 1 AP (bottom) stimulation. Current traces of depolarization-induced somatic APs recorded in current-clamp (red); position of 1 and 10 AP stimulations indicated by marker bars. I, Individual and averaged responses as in H but from recordings of neurons lacking all αNrxns (TKO). Representative samples from at least three independent experiments per genotype are shown.
