Figure 5.
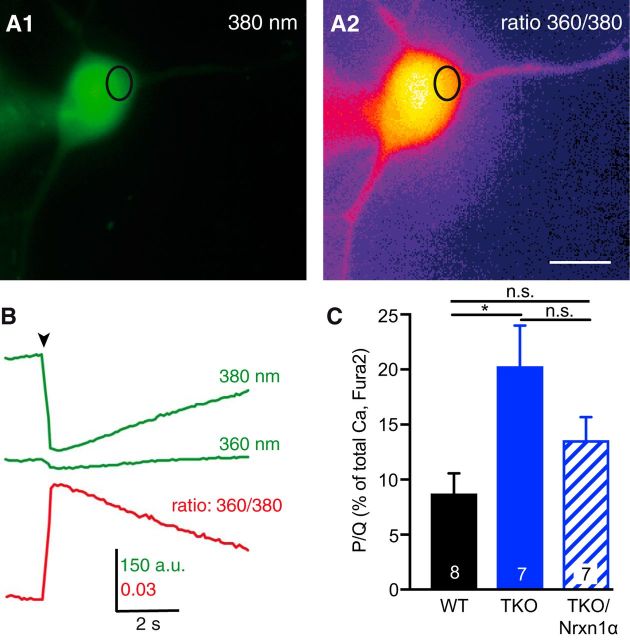
Monitoring Ca2+ influx in the somata of neurons with Fura-2. A, Representative images of a WT neuron loaded with Fura-2 via patch pipette and excited at 380 nm before stimulation (A1). Ca2+ transient by 100 ms depolarization to +20 mV visualized by the 360/380 nm ratio (A2). The oval indicates a ROI for evaluation; Scale bar, 20 μm. B, Sample traces of fluorescence changes within the ROI marked in A at 360 and 380 nm excitation (green). The Ca2+ transient expressed as 360/380 nm ratio is shown below (red). C, Summary of mean peak amplitudes (ΔF/Fo) at 100 ms depolarization, comparing untransfected WT neurons (black bars), TKO neurons (blue) and TKO neurons transfected with Nrxn1α. Bars indicate somatic Ca2+ transients through ω-agatoxin IVA-sensitive P/Q-channels, analyzed in relation to the total Ca2+-transient before wash-in of the blocker. The part of P/Q-channels in somatic Ca2+-transients (in WT: 8.8 ± 1.8%) was increased in TKO (20.3 ± 3.6%; *p = 0.012) and showed a tendency to rescue (not significant: p = 0.191) in TKO-expressing Nrxn1α (13.6 ± 2.1%), this value is not significantly different to WT (p = 0.395). Data are mean ± SEM. n = neurons, as indicated in bars; p values by one-way ANOVA, F(2,19) = 5.17.

