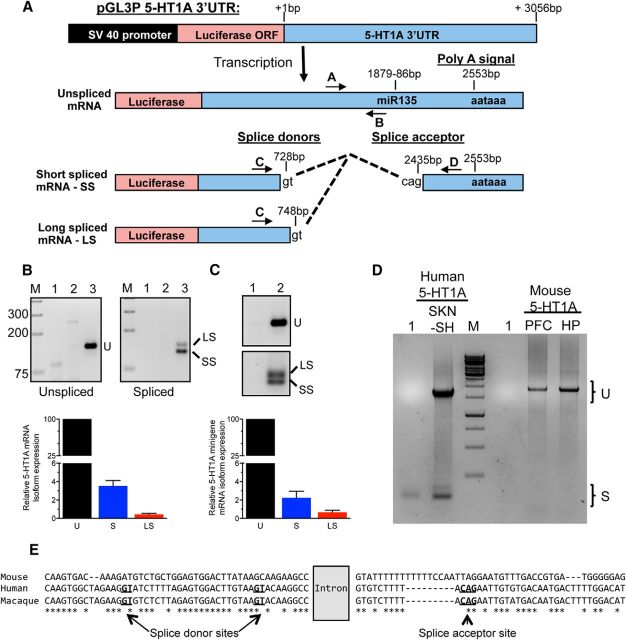
Figure 1.
The 5-HT1A mRNA 3′-UTR is alternatively spliced in human cells to give rise to several mRNA isoforms. A, Schematic representation of the human 5-HT1A 3′-UTR construct used for 3′-RACE experiments, and of primers A–D used to quantify the resulting mRNA variants upon its transfection in human cells (unspliced, LS, and SS). Dashed lines represent the intron removed following splicing of the 3′-UTR. The relative location of the poly-adenylation site (polyA signal), miR135 site, and splice donor (gt dinucleotides) and acceptor (cag) sites are indicated. B, Top, RT-PCR analysis of the 5-HT1A 3′-UTR splice variants in HEK293 cells. RNA from HEK293 cells transfected with luciferase vector pGL3P or pGL3P 5-HT1A-3′-UTR was assessed by RT-PCR for the expression of unspliced (U, top, primers A/B) and spliced 3′UTR isoforms, short (SS) and long (LS) (bottom, primers C/D). M, DNA size markers; 1, negative control; 2, pGL3P; 3, pGL3P 5-HT1A-3′-UTR. Bottom, Real-time PCR quantification of unspliced (100%) and spliced HTR1A mRNA in HEK293 cells transfected with pGL3P 5-HT1A-3′-UTR using probes specific for unspliced, total spliced (S), or LS isoform 5-HT1A mRNA. C, Splicing of human 5-HT1A minigene in stably transfected SKN-SH cells. Top, RT-PCR: cDNA from uninfected cells (Lane 1) or cells infected with the 5-HT1A minigene (Lane 2) were analyzed for the unspliced 3′-UTR (U) or spliced isoforms (SS, LS) using primers shown in A. Below, real-time PCR: relative mRNA levels were normalized to GAPDH using the ΔΔCt method. Data are presented as mean ± SEM of the %unspliced from three independent experiments. D, Undetectable HTR1A RNA splicing in mouse brain. Full-length cDNA from human SKN-SH cells expressing the human 5-HT1A minigene or mouse PFC and hippocampus (HP) tissue was analyzed using two human primers C and D in A or the corresponding mouse 3′-UTR primers (521–2444 bp downstream of the stop codon). Spliced 5-HT1A mRNA isoforms (S) were only detected for the human transcript, while the unspliced form (U) was present in both. M, DNA size markers; 1, negative control. E, Sequence conservation of the mouse, human, and rhesus macaque 5-HT1A 3′-UTR sequences (701/2333 bp; 721/2462 bp; 719/2476 bp, respectively). The splice acceptor and donor sites are in bold and underlined; dashes indicate gaps; * indicates conservation among all three species. Alignment was performed with the multiple sequence comparison by log-expectation [Multiple Sequence Comparison by Log-Expectation (MUSCLE)] at the European Bioinformatics Institute (EMBL-EBI) website (https://www.ebi.ac.uk/Tools/msa/muscle/).

