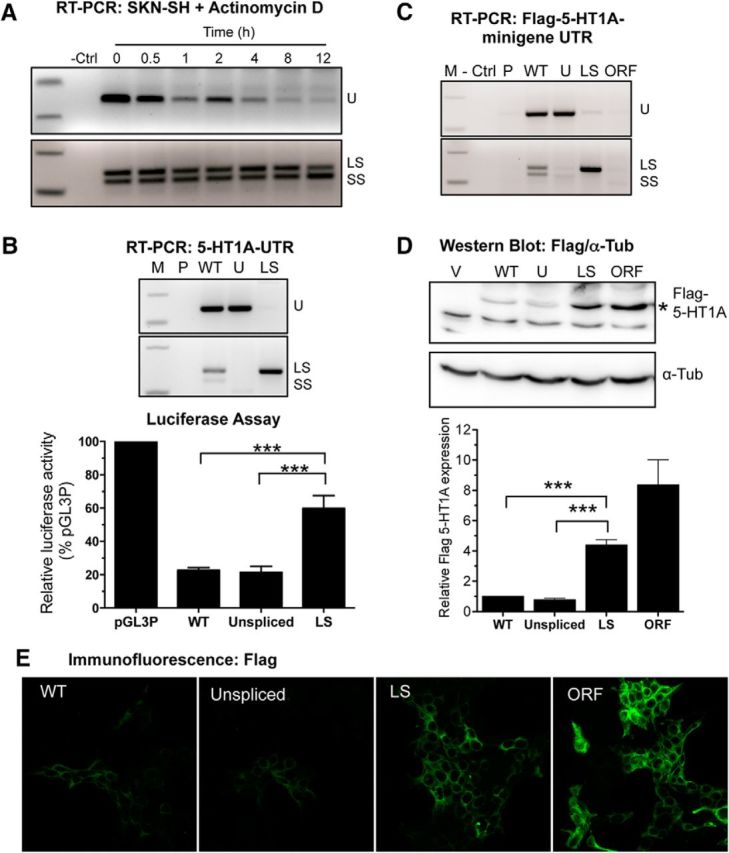
Figure 2.

The 5-HT1A spliced mRNA variants display increased stability and lead to greater protein expression. A, Relative stability of the unspliced (U) and spliced (LS, SS) mRNA isoforms detected by RT-PCR (Fig. 1B) in SKN-SH cells infected with the 5-HT1A WT minigene lentivirus and treated with 10 μg/ml actinomycin D to inhibit de novo transcription. B, Increased luciferase activity from spliced 5-HT1A 3′-UTR. Luciferase constructs containing either the vector (P, pGL3P), WT, unspliceable (U, Unspliced) or constitutively spliced (LS, Spliced) human 5-HT1A 3′-UTR were analyzed (M, DNA size markers). Top, RT-PCR analysis shows equivalent expression of the appropriate 5-HT1A 3′-UTR isoform in SKN-SH cells transfected with the indicated construct. Bottom, SKN-SH cells cotransfected with the indicated construct and pCMV β-galactosidase were assayed for relative luciferase activity, normalized to pGL3P (100%). Data shown as mean ± SEM of 3–5 experiments. ***p < 0.001 one-way ANOVA with Tukey's post hoc test. C–E, Relative expression of Flag-5-HT1A 3′-UTR minigene isoforms. RT-PCR analysis shows equivalent expression of the appropriate 5-HT1A 3′-UTR isoform in SKN-SH cells infected at multiplicity of infection 20 for 72 h with the indicated construct (C). D, Top, Western blot for Flag-5-HT1A fusion protein (*) or tubulin (α-Tub, below) in SKN-SH cells infected with vector (V), WT, U, or LS 3′-UTR minigenes or 5-HT1A coding sequence with SV40 3′-UTR (ORF). D, Bottom, Densitometry analysis of Flag-5-HT1A protein levels relative to tubulin. E, Immunofluorescence for Flag-tag. For densitometry, mean ± SEM from three independent experiments is shown. ***p < 0.001. One-way ANOVA, Tukey's post hoc test.
