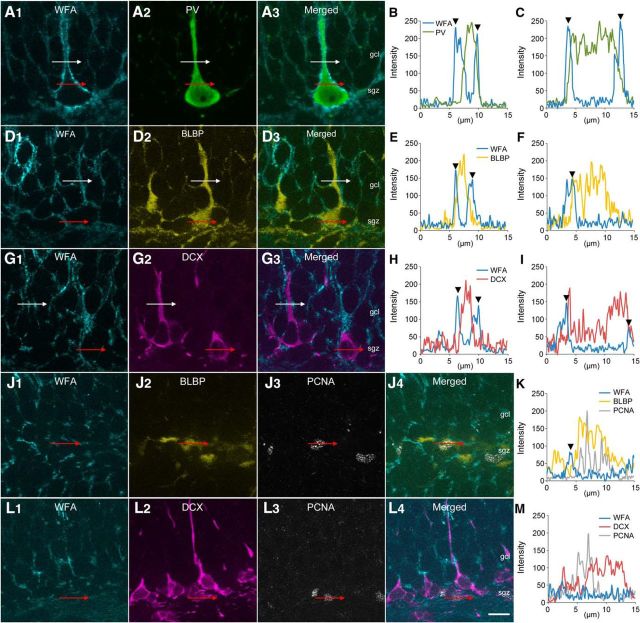
Figure 1.
Localizations of CSPG in the dentate gyrus of the adult mouse hippocampus. A–C, Fluorescence images of WFA+ CSPG (cyan, A1), PV (green, A2), and merged (A3). White lines represent the path crossing the process and its line profile is shown in B. Red lines represent the path crossing the soma and its line profile is shown in C. Arrowheads represent the peak intensities of WFA. D–F, Fluorescence images of WFA+ CSPG (cyan, D1), BLBP (yellow, D2), and merged (D3). White lines represent the path crossing the process and its line profile is shown in E. Red lines represent the path crossing the soma and its line profile is shown in F. Arrowheads represent the peak intensities of WFA. G–I, Fluorescence images of WFA+ CSPG (cyan, G1), DCX (magenta, G2), and merged (G3). White lines represent the path crossing the process and its line profile is shown in H. Red lines represent the path crossing the soma and its line profile is shown in I. Arrowheads represent the peak intensities of WFA. J, K, Fluorescence images of WFA+ CSPG (cyan, J1), BLBP (yellow, J2), PCNA (gray, J3), and merged (J4). Red lines represent the path crossing the soma and its line profile is shown in K. An arrowhead represents the peak intensity of WFA. L, M, Fluorescence images of WFA+ CSPG (cyan, L1), DCX (magenta, L2), PCNA (gray, L3), and merged (L4). Red lines represent the path crossing the soma and its line profile is shown in M. Scale bar in L4 = 10 μm and applies to A, D, G, J, and L.

