Figure 5.
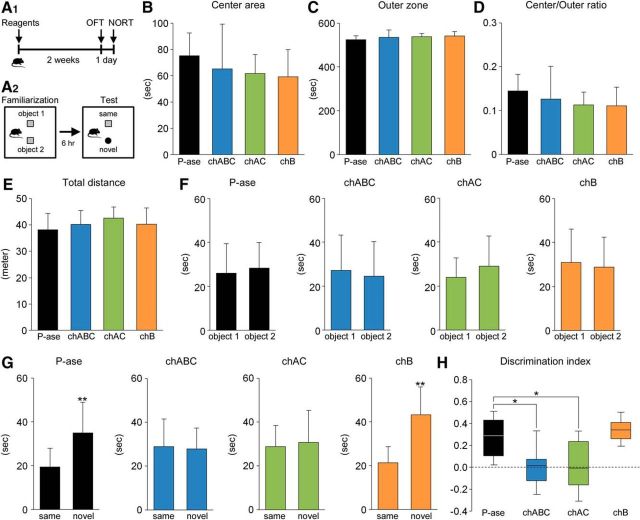
Impairment of cognitive memory following CSPG digestion. A, Schematic diagram of the behavior experiment. Two weeks after the intradentate injection of P-ase, chABC, chAC, or chB, mice were evaluated by OFT (A1). The next day, the same animals were subjected to NORT (A2). In the test session (6 h after the familiarization session), object 2 was changed to a novel object. B–D, Time (in seconds) spent in the center area (B; F(3,45) = 2.2696, p = 0.0933) and the outer zone (C; F(3,45) = 2.2696, p = 0.0933) of the open-field apparatus and the ratio of time spent in center area/outer zone (D; F(3,45) = 2.2558, p = 0.0948). E, Total distance of traveled (in meters) of mice treated with P-ase, chABC, chAC, or chB (F(3,45) = 1.2529, p = 0.3019). F, Time (in seconds) spent exploring the object 1 and 2 during the familiarization session in mice treated with different enzymatic reagents (P-ase, t (18.30) = 0.3008, p = 0.767; chABC, t (21.99) = 0.4100, p = 0.6857; chAC, t (18.49) = 1.0337 p = 0.3416; chB, t (23.73) = 0.3945, p = 0.6967). Data were analyzed by Welch's t test and are shown as mean ± SD (P-ase, n = 12 mice; chABC, n = 12 mice; chAC, n = 12 mice; chB, n = 13 mice). G, Time (in seconds) spent exploring the (same and novel) objects during the test session in mice treated with different enzymatic reagents (P-ase, t (18.26) = 3.3041, p = 0.0038; chABC, t (20.45) = 0.2269, p = 0.8227; chAC, t (19.02) = 0.3714, p = 0.7144; chB, t (18.62) = 5.1287, p < 0.0001). Data were analyzed by Welch's t test and are shown as mean ± SD (P-ase, n = 12 mice; chABC, n = 12 mice; chAC, n = 12 mice; chB, n = 13 mice). H, Using the same dataset, the discrimination index (time spent with the novel object − time spent with the same object)/(total time exploring both objects) was calculated for each mouse (F(3,45) = 11.1290, p < 0.0001). Discrimination indices of 0 indicate equal exploration of both objects. The central rectangle spans the first quartile to the third quartile. The segment in the rectangle shows the median. The whiskers above and below the box show the locations of the minimum and maximum. Data were analyzed by one-way ANOVA with post hoc Tukey's HSD test. Statistical significance: *p < 0.05, **p < 0.01 (vs. same for G; vs. P-ase for H).

