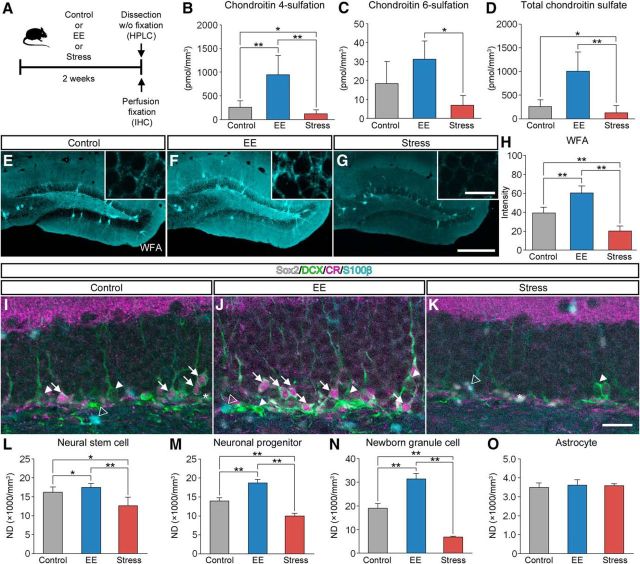
Figure 6.
Increase in the expression levels of CSPG in the dentate gyrus by EE. A, Schematic diagram of the experiment to see the effect of housing conditions on CSPG in the hippocampus. Mice were housed in standard conditions (control), subjected to forced swim stress (stress), or housed in an EE for 2 weeks, after which they were killed for HPLC or IHC. B–D, The amount of CS-4 (B; pmol/mm3; F(2,10) = 14.7782, p = 0.0010), CS-6 (C, pmol/mm3; F(2,10) = 6.9297, p = 0.0129), and total CSPG (D; pmol/mm3; F(2,10) = 14.5957, p = 0.0011) in the dentate gyrus. Data were analyzed by one-way ANOVA with post hoc Tukey's HSD test and are shown as mean ± SD (control, n = 5 mice; EE, n = 4 mice, stress, n = 4 mice). E–G, Fluorescence images of WFA+ CSPG (cyan) in the dentate gyrus of mice housed in standard conditions (E), housed in an EE (F), or exposed to forced swim stress (G). H, Fluorescence intensities of WFA+ CSPG in the dentate gyrus (F(2,21) = 126.0423, p < 0.0001). Data were analyzed by one-way ANOVA with post hoc Tukey's HSD test and are shown as mean ± SD (n = 8 mice in each group). I–K, Fluorescent quadruple staining for Sox2 (gray), DCX (green), CR (magenta), and S100β (cyan) in the dentate gyrus of mice housed in standard conditions (I), housed in an EE (J), or exposed to forced swim stress (K). Four types of adult neurogenesis-related cells are defined as follows: Sox2+/DCX−/CR−/S100β− neural stem cells (white asterisks), Sox2−/DCX+/CR−/S100β− neuronal progenitors (white arrowheads), Sox2−/DCX+/CR+/S100β− newborn granule cells (white arrows), and Sox2+/DCX−/CR−/S100β+ astrocytes (open arrowheads). L–O, NDs of neural stem cells (L; F(2,21) = 22.5541, p < 0.0001), neuronal progenitors (M; F(2,21) = 32.7305, p < 0.0001), newborn granule cells (N; F(2,21) = 294.4005, p < 0.0001), and astrocytes (O; F(2,21) = 0.7413, p = 0.4885) in the dentate gyrus. Data were analyzed by one-way ANOVA with post hoc Tukey's HSD test and are shown as mean ± SD (n = 8 mice in each group). Statistical significance: *p < 0.05, **p < 0.01 (between groups). Scale bars: G, 200 μm (applies to E–G); inset of G, 20 μm (applies to insets of E–G); K, 30 μm (applies to I–J).

