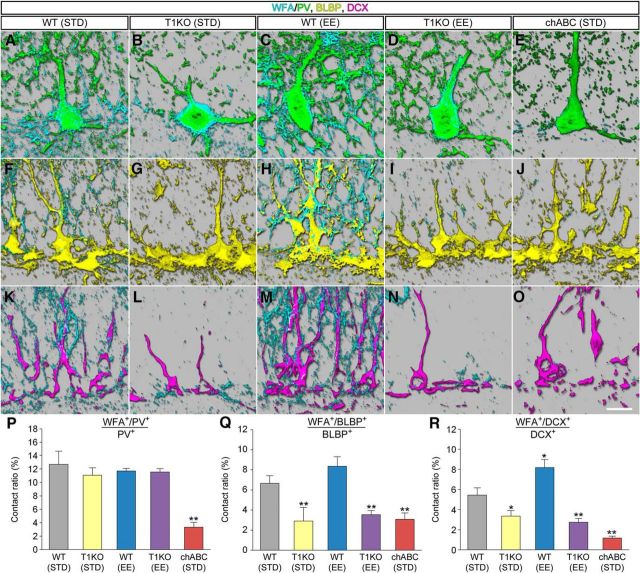
Figure 9.
Localizations of CSPG in the dentate gyrus of T1KO mice. A–E, WFA+ CSPG (cyan) around PV+ cells (green) in the dentate gyrus of WT (STD) mice (A), T1KO (STD) mice (B), WT (EE) mice (C), T1KO (EE) mice (D), and chABC (STD) mice (E). F–J, WFA+ CSPG (cyan) around BLBP+ cells (yellow) in the dentate gyrus of WT (STD) mice (F), T1KO (STD) mice (G), WT (EE) mice (H), T1KO (EE) mice (I), and chABC (STD) mice (J). K–O, WFA+ CSPG (cyan) around DCX+ cells (magenta) in the dentate gyrus of WT (STD) mice (K), T1KO (STD) mice (L), WT (EE) mice (M), T1KO (EE) mice (N), and chABC (STD) mice (O). P, The proportions (percentage) of WFA+/PV+ voxels in total PV+ voxels in the granule cell layer (F(4,10) = 33.0314, p < 0.0001). Q, The proportions (percentage) of WFA+/BLBP+ voxels in total BLBP+ voxels in the granule cell layer (F(4,10) = 24.921, p < 0.0001). R, The proportions (percentage) of WFA+/DCX+ voxels in total DCX+ voxels in the granule cell layer (F(4,10) = 82.1291, p < 0.0001). Data were analyzed by one-way ANOVA with post hoc Tukey's HSD test and are shown as mean ± SD (n = 3 mice in each group). Statistical significance: *p < 0.05, **p < 0.01 [vs. WT (STD)]. Scale bar in O, 10 μm (applies to A–O).

