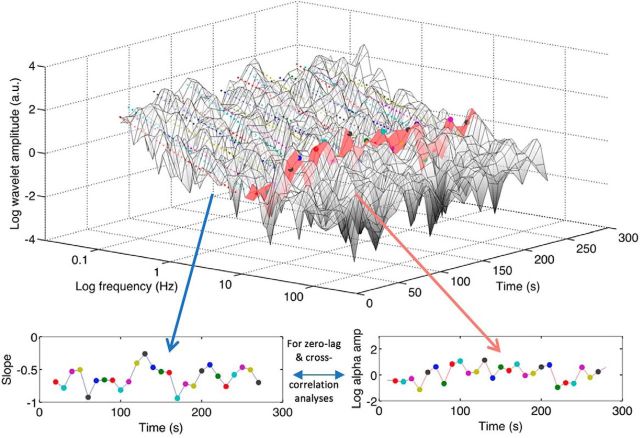
Figure 1.
Illustration of a time- and frequency-resolved approach to data analysis. Time-frequency presentation from one sensor of a typical dataset using log-scaled wavelet analysis. The time course of alpha activity as estimated by continuous wavelet analysis is extracted (inset, bottom right) and, with the same temporal resolution and zero time lag, the time course of the slope of spectral activity <5 Hz is estimated (inset, bottom left). A linear correlation between these two time-series is then performed at zero-lag to examine the link between the two features (see Materials and Methods; see Fig. 4). For analysis of a potential temporal precedence of one of the two signals, time lag was varied (see Fig. 6).

