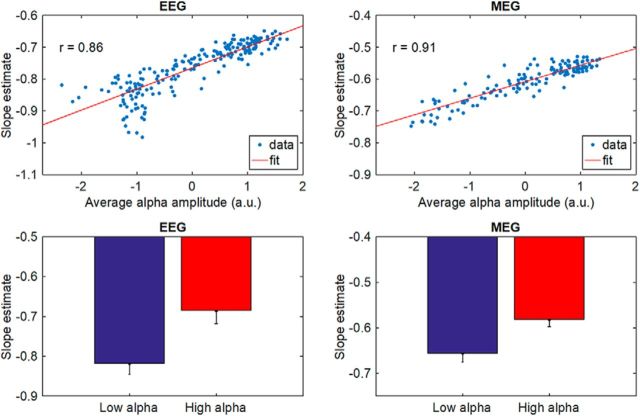
Figure 3.
Both in EEG (top left) and MEG recordings (top right), average alpha power at different electrodes (EEG, r = 0.86, n = 203) and sources (MEG, r = 0.91, n = 138) correlates positively with slope coefficients estimated in the frequency range <4.8 Hz. As slopes are negative, this means that higher alpha activity is associated with less steep power decline at the higher frequencies in the sub-alpha range, a sign of reduced self-similarity and LRD. This is not only consistent across electrodes or sources, but also across subjects: there is a significant difference in slope when comparing the 30 strongest alpha power sources (compare topography in Fig. 2) versus the 30 weakest power sensors or sources within subjects (pairwise t test, p < 6e-3 and p < 6e-5 for EEG and MEG, respectively).

