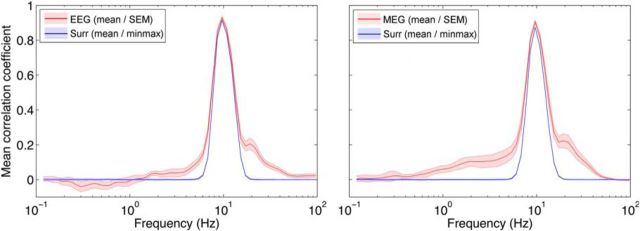
Figure 5.
Correlation of alpha activity with spectral activity across the available range (left: EEG; right: MEG). Red line indicates real data. Blue line indicates surrogate data that are devoid of any cross-frequency couplings. The effect ∼10 Hz reflects the frequency resolution of the chosen continuous wavelet approach. In the spectral range outside a frequency window of 6–11 Hz, no trivial cross-frequency correlation with alpha activity is to be expected. Also of interest is the remarkable linear decay of the correlation between alpha envelope and lower frequency envelope dynamics (especially for the cleaner MEG data) without enforcing any slope-like behavior.

