
Figure 7.
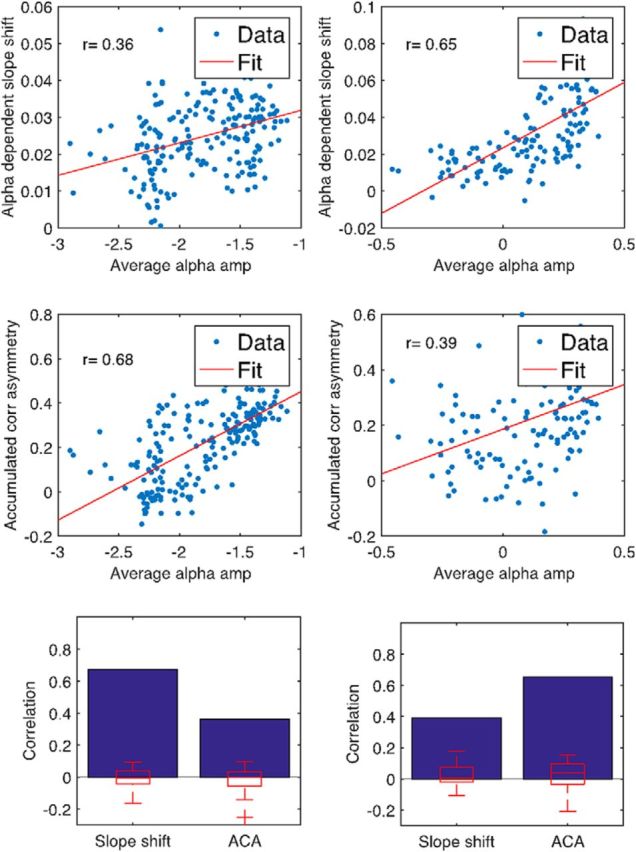
Both the reported slope shift analysis (top; see also Fig. 3) and the analysis of temporal precedence, that is, the accumulated correlation asymmetry (middle panels; compare also Fig. 6), show not only significant effects in the selected sensor or source cluster averages but are also systematically linked to the amount of average alpha activity in each individual sensor or source (left panels: EEG, n = 203; right panels: MEG, n = 138). A stronger prevalence of alpha activity entails stronger effects. To rule out potential spurious correlations, we tested this against the surrogate data obtaining significant (p < 0.05) effects (bottom row). Maximum statistics from surrogate runs (n = 19) did not reach the level of correlation of real data (summarized in blue), with the correlation coefficients of the surrogate runs indicated by the boxplots (in red). Whiskers indicate minima and maxima; +, outliers.