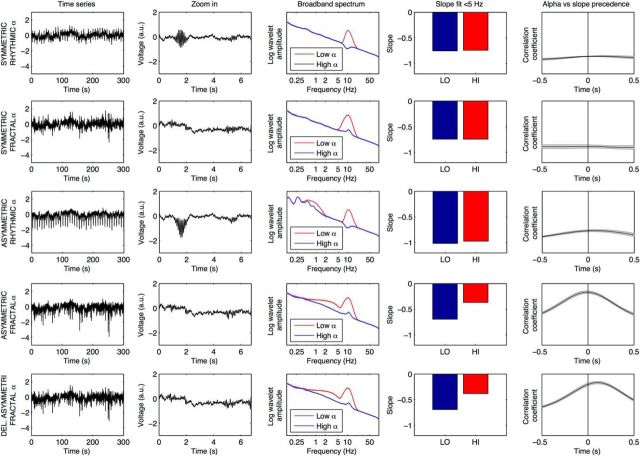
Figure 8.
Modeling the effect of varying temporal dynamics of alpha oscillations and associated baseline shifts on slope estimations (for details, see Materials and Methods). First row, Model 1, represents rhythmic alpha pulsing, that is every 4 s with alpha oscillating (strong burst always followed by a weak burst) and no baseline shift. A zoom-in visualizes the symmetry of modeled alpha oscillations. The next panel represents the broadband power for high versus low alpha amplitudes. The fourth panel represents the same data for the analyzed frequency range <5 Hz. The last panel in each row represents the estimated correlations as a function of lag time in the correlogram. Second row, Model 2, represents rhythmic alpha with associated baseline shifts. Models 3 and 4 use fractally distributed alpha fluctuations. Model 3 involves no baseline shift during alpha oscillations, whereas Model 4 does. Model 4 shows similar alpha-dependent slope changes as the real data, distributed smoothly across frequencies <5 Hz. Model 5 in the lowest row is identical to Model 4, but with a 100 ms delay of alpha-dependent baseline shifts. Only this model shares a temporal precedence of alpha versus slope shift with the empirical data.

