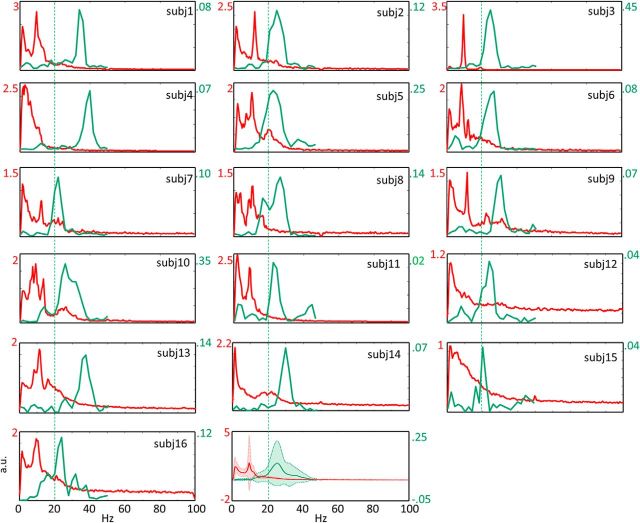
Figure 2.
Individual FSM1 power spectral densities and FSM1 coherence with the muscle. Red represents the power spectral density (PSD) of the FSM1 in the 3 min period of a resting state with open eyes for each subject (Figs. 3–5 are color-coded similarly). PSD values are calculated equaling the peak of FSM1(t) to 1. Green represents the coherence between FSM1 and the OP' EMG (CMC) during the ∼3 min of 20 s periods of isometric contractions. Vertical dashed line indicates 20 Hz. The last plot represents the means and SDs across 16 subjects. PSD and CMC scales are shown in respective colors.

