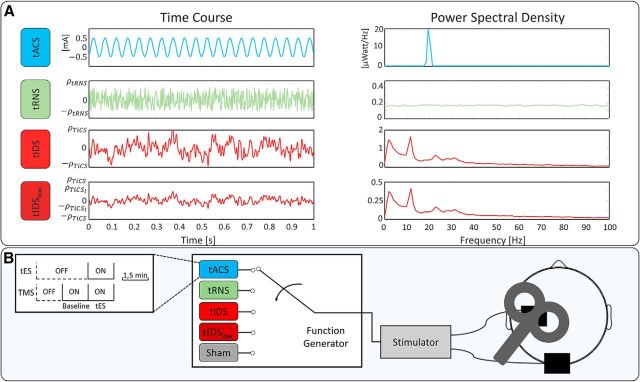
Figure 3.
Experimental setup for testing tIDS neuromodulation efficacy. A, In a representative subject, the time course (left, mA) and power spectral density (right, μWatt/Hz) of the four tESs delivered. Current amplitudes were defined to deliver the same power as tACS (at 1 mA as in Feurra et al., 2011) for tRNS and tIDS. tIDSlow has the power corresponding to 0.85 mA peak-to-peak sine (20 Hz tACS as in Cancelli et al., 2015b). PSD scale is ¼ of the tIDS scale. B, Representation of the tES/TMS session: each of the 5 tES stimulations (tACS, tRNS, tIDS, tIDSlow, and sham, delivered in random order for each subject) lasted 1.5 min and was alternated with intervals of 3 min rest. tESs were delivered through two equal 7 × 5 cm2 rectangle electrodes positioned above C3 and Oz and the TMS coil positioned above C3. For each tES, we delivered TMS during the 1.5 min while the tES was on and in the previous 1.5 min with ES off, providing the baseline MEP values for the following stimulation.

