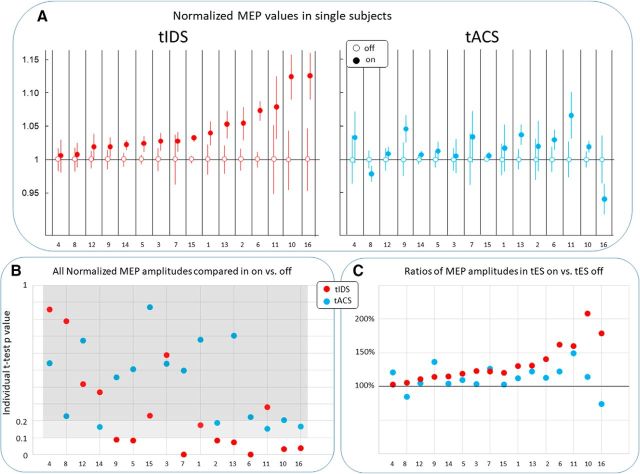
Figure 5.
Efficacious neuromodulations: individual effects. In each individual subject, ordered for tIDS response. A, Individual means and SE of normalized MEP for tACS and tIDS. B, p values of the individual comparison of all repetitions in off and on tES, for tACS (light blue), and tIDS (red) by independent-sample two-tailed t test. tACS did not induce an effect <0.100 of the significance threshold (white area) in any of the subjects, whereas tIDS induced this effect in 8 of 16 subjects. Lighter gray area represents 0.100 < p < 0.200. Darker gray area indicates p > 0.200. C, The percentage changes of MEP during tES on with respect to tES off for the two tACS and tIDS. Black horizontal line indicates no change (i.e., 100%). It is noteworthy that, in the 5 subjects with tACS at significance <0.200 (Subjects 2, 10, 11, 14, and 16), tIDS induced a greater neuromodulation effect than tACS (significantly more in Subjects 2, 10, and 16).

