
Figure 1.
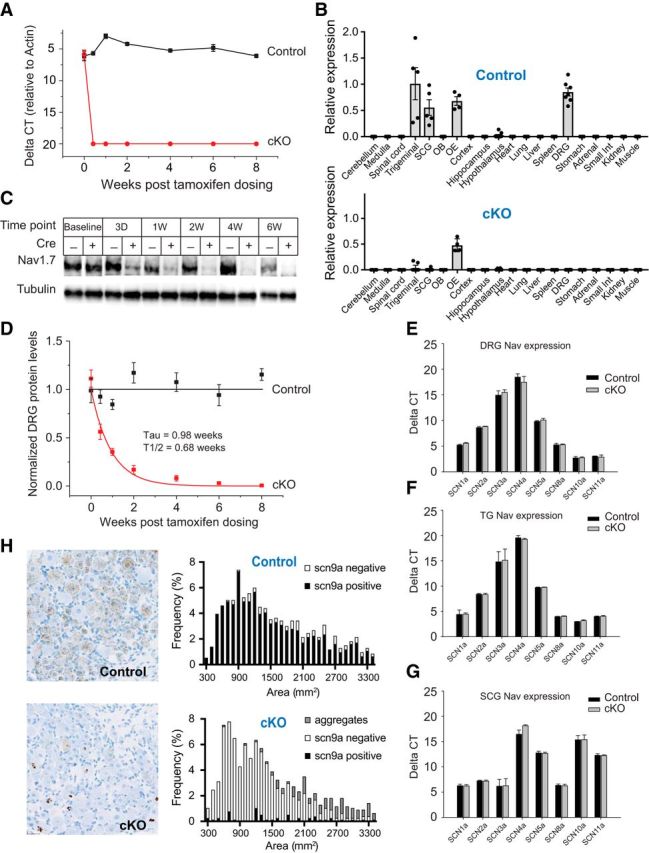
Expression distribution of scn9a mRNA and characterization of Nav1.7 deletion in cKO mice. A, Time course of loss of scn9a mRNA from DRG of Nav1.7 cKO mice (red circles). Signal is undetectable at all post-tamoxifen time points. Black squares represent control littermates. n = 6 mice/genotype. B, Tissue distribution of scn9a mRNA in Nav1.7 cKO mice and control mice. Relative expression of Nav1.7 cKO and control was normalized to the level observed in WT trigeminal ganglia. Tissues are as indicated. OB, Olfactory bulb; OE, olfactory epithelium. C, Example Western blot of Nav1.7 protein from DRG lysates 3 d and 1, 2, 4, or 6 weeks following tamoxifen injection. Tubulin immunostaining is shown as a loading control. D, Time course of loss of Nav1.7 protein from DRG of Nav1.7 cKO mice (red) as measured by Western blot. Decay constant (τ) = 0.98 ± 0.19 weeks. No detectable Nav1.7 protein loss was observed in DRGs from control mice (black). E–G, Expression of other Nav channel mRNAs in DRGs (E), TGs (F), and SCGs (G) following tamoxifen injection (after 8 weeks) from Nav1.7 cKO mice (gray) or control mice (black). No significant differences in Nav channel mRNA levels were observed (except for scn9a). H, Representative images of scn9a ISH in DRG from a Nav1.7 cKO mouse and a control mouse. scn9a mRNA was detected in 838 of 933 (90%) DRG neurons pooled from 3 control mice, representing all soma cross-sectional areas. Black bars represent scn9a-positive. White bars represent scn9a-negative. scn9a mRNA was detected in 46 of 770 (6%) DRG neurons pooled from 3 Nav1.7 cKO mice. Black bars represent scn9a-positive. White bars represent scn9a-negative. Gray bars represent nuclear aggregates. Error bars indicate SEM.