Figure 10.

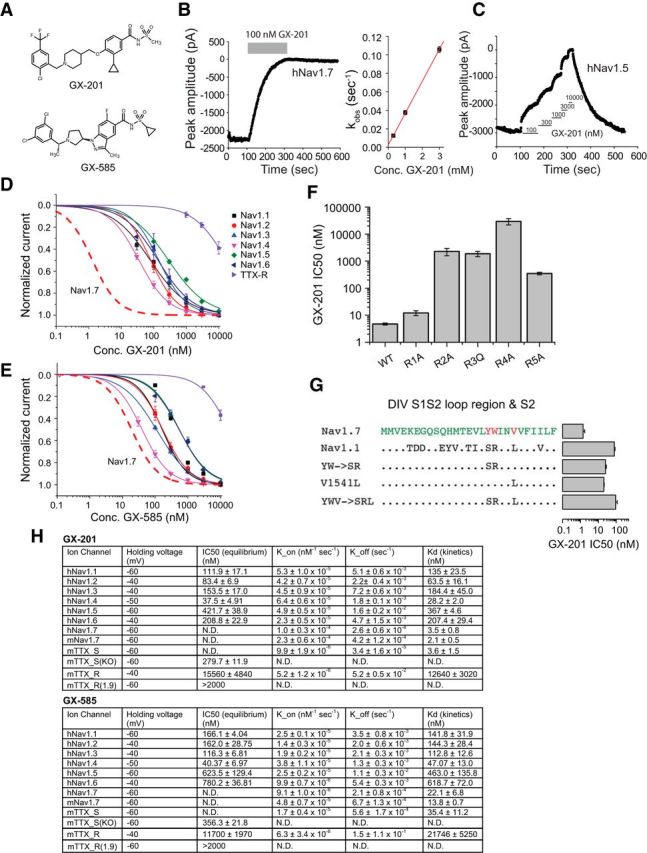
Selectivity profiles of GX-585 and GX-201. A, Chemical structures of GX-201 and GX-585. B, Example trace showing a voltage-clamp recording of human Nav1.7 where each point represents the peak current amplitude during a 20 ms pulse to 0 mV. The blocking effect of 100 nm GX-201 as well as the very slow off-rate are shown. Right, Linear relationship between K_obs and GX-201 concentration, which was used to calculate the on-rate (K_on). C, Example trace showing a measurement of the IC50 of GX-201 on human Nav1.5. D, IC50 curves showing the selectivity pattern of GX-201 against human Nav1.1–1.8 channels. Red dashed trace represents the expected IC50 curve for GX-201 on hNav1.7 based on the Kd measured using kinetics. E, Selectivity pattern for GX-585 against human Nav1.1–1.8 channels. F, IC50 values of GX-201 on WT hNav1.7 and S4 voltage-sensor arginine mutants. G, IC50 values of GX-201 on hNav1.7, hNav1.1, and hNav1.7 mutants showing the residues driving selectivity. H, Table showing holding voltages used for each channel subtype, equilibrium IC50 values, kinetics parameters, and calculated Kd values. mTTX_S and mTTX_S(KO) refer to TTX-sensitive channels recorded in WT and Nav1.7 cKO mouse DRG neurons, respectively. mTTX_R and mTTX_R(1.9) refer to mouse TTX-resistant channels recorded in WT and Nav1.8 KO DRG neurons, respectively. In the absence of Nav1.8, the TTX-resistant current is carried entirely by Nav1.9 channels. Error bars indicate SEM.
