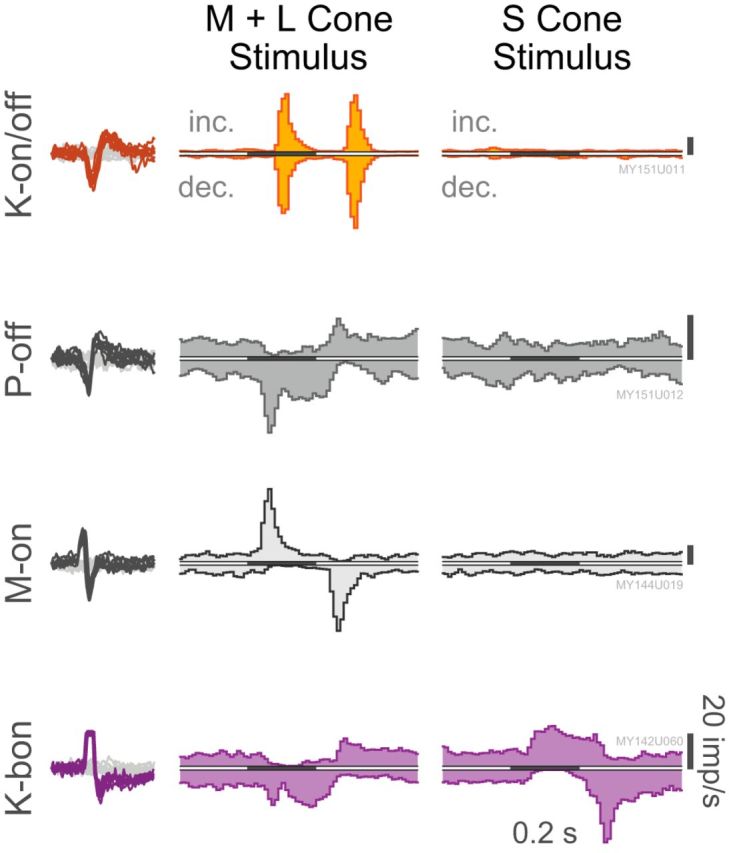
Figure 1.

Response profiles of a typical K-on/off cell, P-off cell, M-on cell, and K-bon cell to small uniform increments (inc.) and decrements (dec.) of M+L and S-cone contrast. Scale bars, 20 imp/s. Isolated spike waveforms for these cells are also shown superimposed against noise threshold crossings. Cells were recorded at 3.1°, 1.7°, 1.6°, and 2.2° eccentricity from the fovea, respectively. Histograms are binned at 10 ms resolution, and have been smoothed using a three-point moving average.
