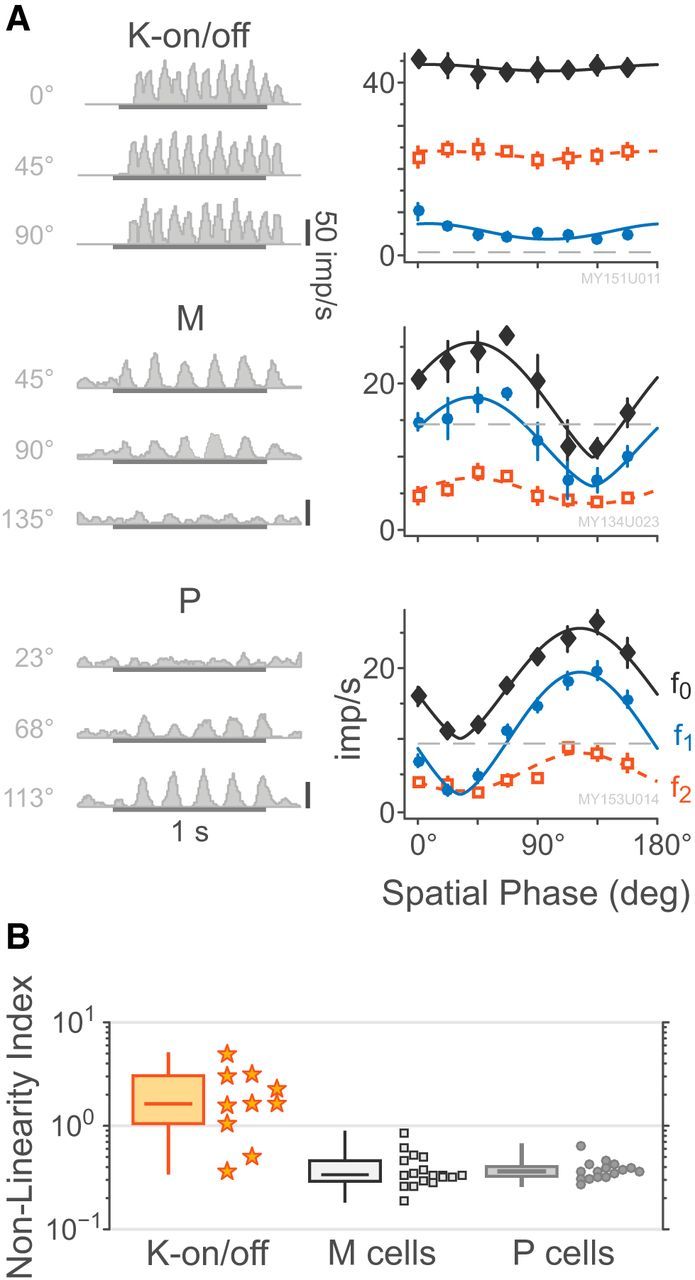
Figure 10.

Responses to stationary counterphase stimuli. A, Example PSTHs and spatial phase sensitivity curves for a K-on/off cell, an M-on cell, and a P-off cell, following the style of Figure 5. Example PSTHs are chosen relative to each cell's preferred phase (top), null phase (bottom), and intermediate between those two. The eccentricities of the cells are 3.1°, 6.5°, and 2.6°, respectively. Smooth curves show the fitted raised sine model as given by Equation 9. B, Distributions of measured cell nonlinearity index. Box plots show median, range, and interquartile range. K-on/off cells are more nonlinear than P or M cells.
