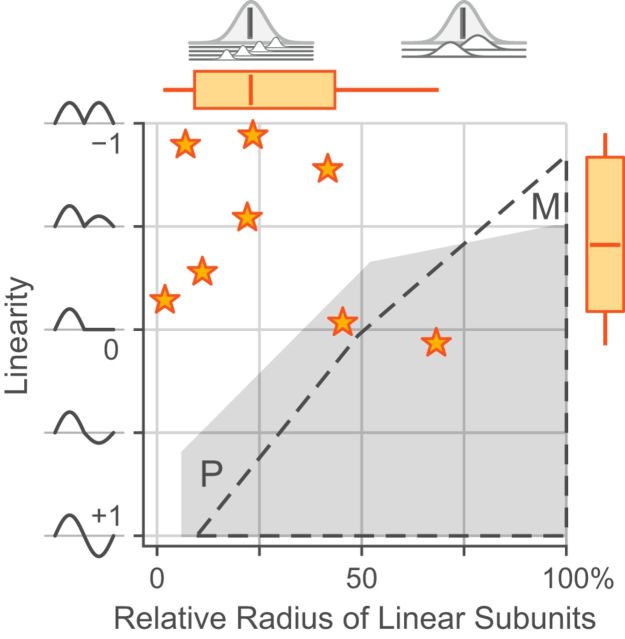
Figure 14.
Comparison of linearity index and relative subunit radius for K-on/off cells. The region in which fitted values for P and M cells fall are indicated. Box plots show median, range, and interquartile range. The interpretations of the two parameter measures are illustrated at left and above the graph.

