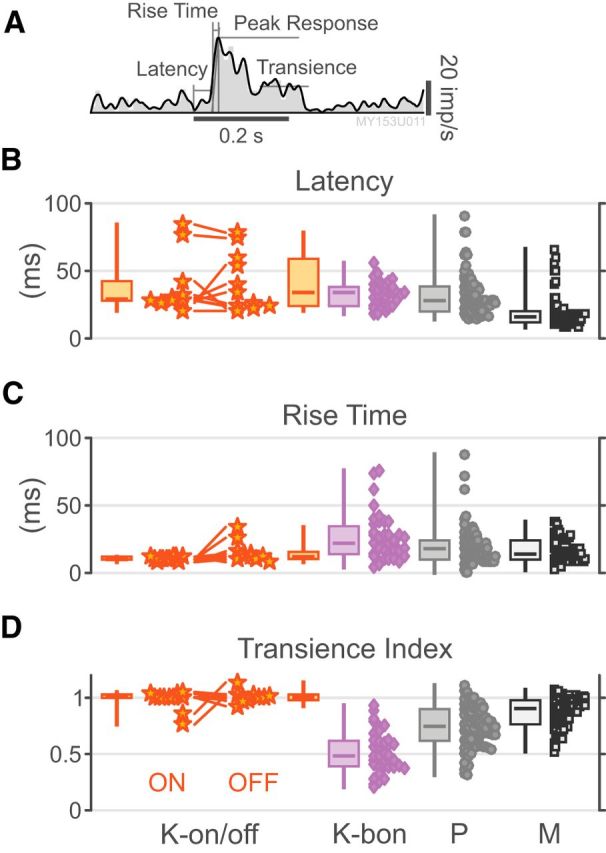
Figure 4.

K-on/off cell temporal response properties. A, PSTH demonstrating LOESS regression line, onset latency, peak response, rise time, and sustained response for an example P on cell. B–D, Distributions of onset latency, rise time, and transience index for K-on-off cells, K-bon cells, P cells, and M cells. Measurements for K-bon cells are derived from S-cone stimuli; metrics for other cells are derived from M+L-cone stimuli. Responses to both increments and decrements are shown for K-on/off cells.
