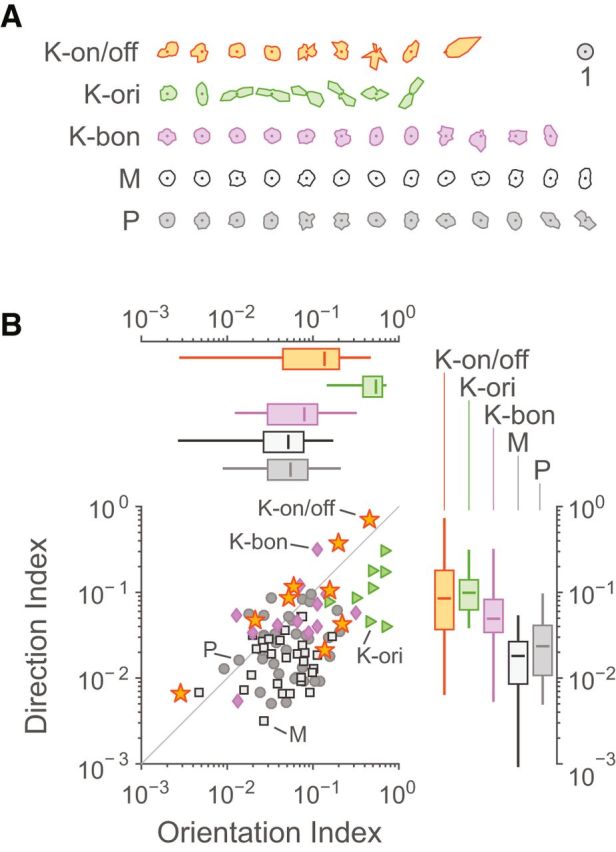
Figure 7.

Direction and orientation tuning. A, Direction tuning curves for K-on/off cells, K-ori cells, K-bon cells, M cells, and P cells, arranged from least to most orientation-tuned. Curves are normalized such that each cell's average response is 1. B, Distributions of direction and orientation selectivity indices. Box plots show median, range, and interquartile range.
