Figure 2.

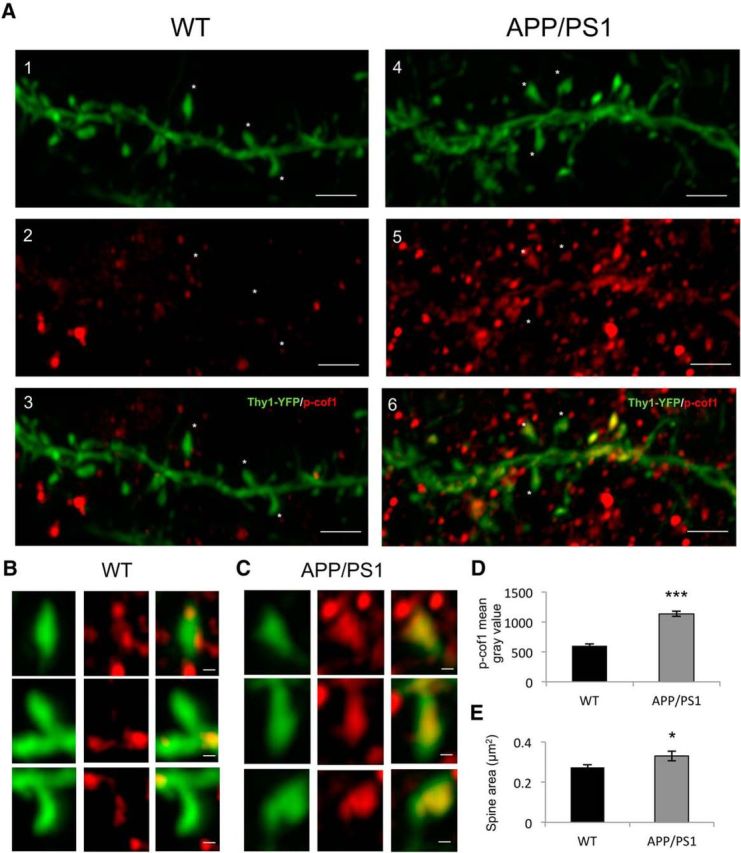
p-cof1 increases in dendritic spines of APP/PS1 mice. A, p-cof1 expression in cortical dendritic spines of Thy1-YFP WT (1–3) and Thy1-YFP APP/PS1 (4–6) mice. Airyscan images of WT and APP/PS1 cortical dendrites (green) showing general higher p-cof1 (red) immunostaining for APP/PS1 mouse. Scale bar, 2 μm. Stars indicate higher magnification of representative dendritic spines for either WT (B) and APP/PS1 (C) mice, showing clearly distinct distribution and higher expression level of p-cof1 in APP/PS1 dendritic spine. Scale bar, 0.2 μm. D, Measurement of p-cof1 staining intensity in WT versus APP/PS1 mice with their relative quantification (mean gray value ± SEM) showing a significative increase in transgenic mice (t values t(136) = 2.116, p = 0.0362, unpaired t test). E, Measurement of spine area in WT versus APP/PS1 mice with their relative quantification (mean ± SEM) showing a significant increase in transgenic mice (t values t(136) = 9.778, p < 0.0001, unpaired t test), n = 71 (WT) and 67 (APP/PS1) spines. *p < 0.05. ***p < 0.001.
