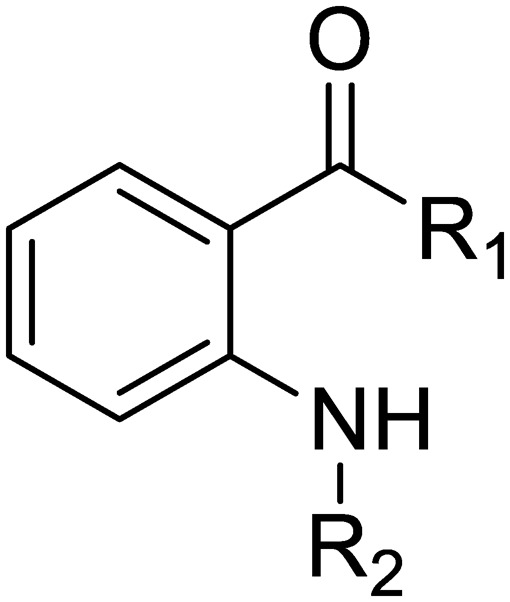
Table 1. Minimum pharmacophore determination. Compounds were tested for activity against M. tuberculosis (MBC4.5) and HepG2 cells (IC50). MBC4.5 are reported as the median. HepG2 IC50 are reported as the mean ± standard deviation. The number of replicates is in parentheses.

| |||||
| Cpd | ID | R1 | R2 | MBC4.5 (μM) | HepG2 IC50 (μM) |
| 1 | IDR-0019306 | 2,4-Cl–Ph–NH- | 4-Br–Ph–SO2- | 6.3 (5) | 6.2 ± 1.1 (3) |
| 3 | IDR-0597329 | 4-Cl–Ph–NH- | 4-Br–Ph–SO2- | 50 (2) | 11 ± 4.7 (2) |
| 4 | IDR-0484542 | PhNH- | 4-Br–Ph–SO2- | 100 (2) | 30 ± 3.5 (2) |
| 5 | IDR-0597554 | EtNH- | 4-Br–Ph–SO2- | >200 (3) | >100 (3) |
| 6 | IDR-0597555 | H2N- | 4-Br–Ph–SO2- | >200 (3) | >100 (3) |
| 7 | IDR-0596462 | 2,4-Cl–Ph–NH- | Ph–SO2- | >200 (4) | 19 ± 9.2 (2) |
| 8 | IDR-0596461 | 2,4-Cl–Ph–NH- | Me–SO2- | 75 (2) | 78 ± 29 (2) |
| 9 | IDR-0597928 | 2,4-Cl–Ph–NH- | H- | 200 (4) | 40 ± 2.3 (3) |
