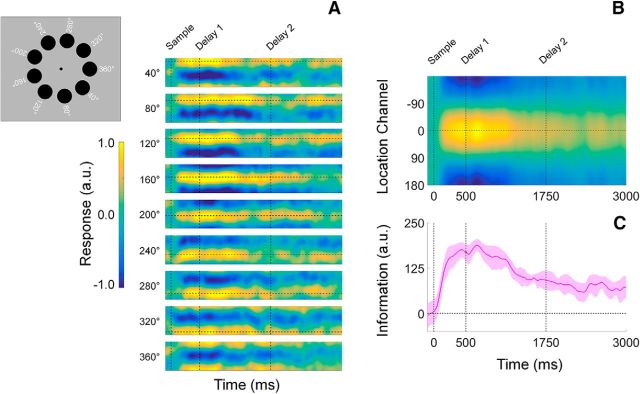
Figure 3.
Computing time-resolved reconstructions of stimulus location. A, Location reconstructions for each of the nine possible stimulus locations from 40° to 360°. The dashed horizontal line in each plot shows the polar location of the stimulus, while the vertical dashed lines at times 0, 500, and 1750 mark the start of the sample epoch, first delay period, and second delay period, respectively (the time axis is identical to that shown in B and C). The inset to the left shows each of the nine possible disc locations on each trial. Reconstructions have been pooled and averaged across stimulus identity (i.e., red vs blue disc) and cue condition (VE, VL, and neutral). B, We circularly shifted the reconstructions shown in A to a common center (0°) and averaged them, yielding a single time-resolved location reconstruction. The response scale is identical to that shown in A. C, We converted the reconstructions shown in B to polar form and projected them onto a vector with angle 0°. We interpreted the resultant vector length as a measure of total location-specific information. Shaded regions represent the 95% within-participant confidence interval.

