Figure 1.
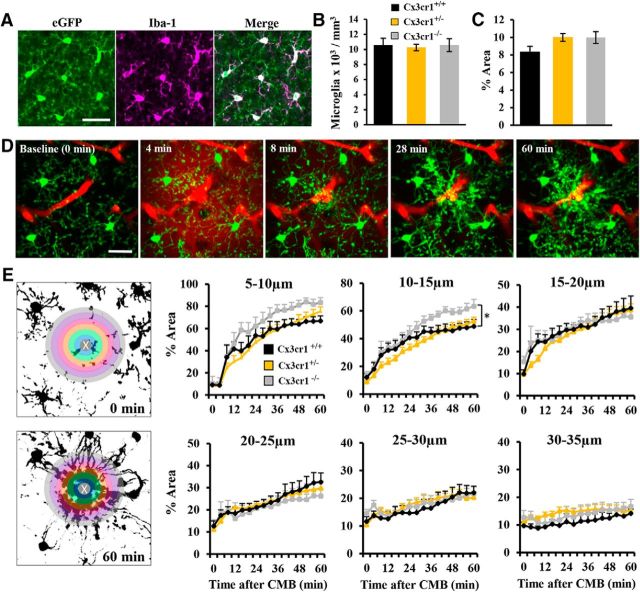
Cx3cr1+/− eGFP reporter mice show normal microglial responses to CMB. A, Confocal images demonstrating that eGFP labeled microglia colocalize with Iba-1, a classical marker of microglia. Bar graphs show the density of microglia (B) and average percentage area (C) of microglia in each genotype. D, In vivo time lapse images showing microglial responses to CMB in a Cx3cr1+/− mouse given intravenous Evans blue dye to label blood vessels. E, Graphs show the progressive accumulation of microglial processes (expressed as percentage area) in 5 μm radii around the CMB in Cx3cr1+/+ (7 CMBs from 6 mice), Cx3cr1+/− (14 CMBs from 13 mice), and Cx3cr1−/− (6 CMBs from 4 mice) mice. The center of the bleed (0–5 μm) was omitted from the analysis due to the presence of auto-fluorescent signal. *p < 0.05 compares Cx3cr1+/+ to Cx3cr1−/− at 10–15 μm. Scale bars: A,D,E = 20 μm. Data were analyzed with one-way ANOVA (B–C) or two-way repeated-measures ANOVA with post hoc t tests (E).

