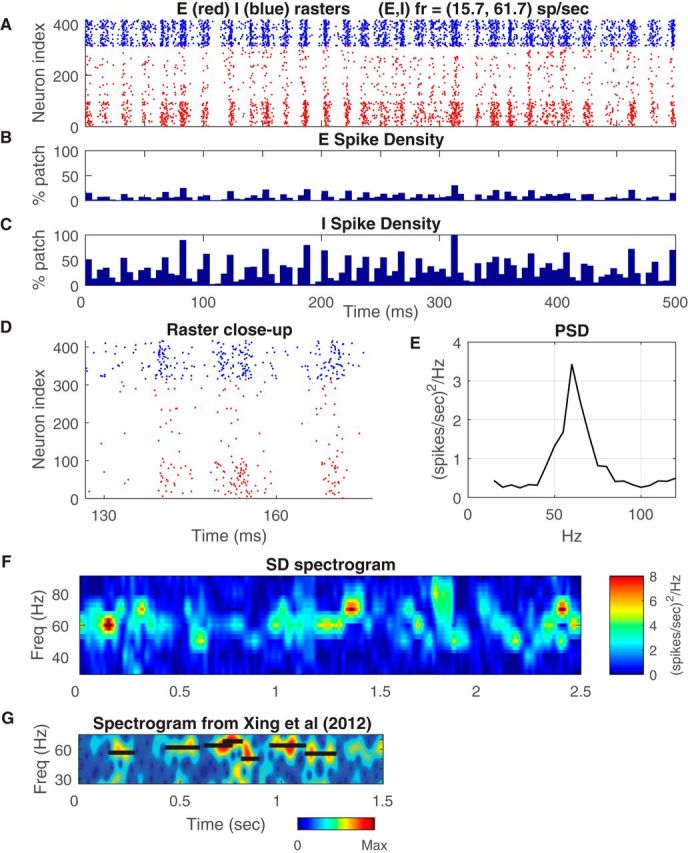
Figure 1.

Dynamics of local population in the CSY model. A, Rasters of spikes of cells in a patch of 400 E- and I-cells in the vertical-preferring domain of a cortical hypercolumn. These are spike time rasters during stimulation by an optimal (vertical) grating, drifting at 4 Hz (250 ms period). The x-axis is time; y-axis is neuron index within the patch. E-cell spikes are red dots, sorted by decreasing number of LGN inputs: the cells near the bottom are likely complex; I-cell spikes are blue dots. B, SD of the E population as a function of time, shown in 5 ms windows. Vertical scale is the fraction of the total number of cells in the patch spiking in that window. C, Corresponding SD plot of the I population. D, Magnified view of the raster in A. SSI/SSInull for this population ∼1.8 ± 0.01. E, PSD of the SD of the E-cells in A, indicating broadband fluctuations with a peak in the gamma-band at ∼60 Hz. At peak, the standard deviation of the PSD was ± 0.14 (spikes/s)2 /Hz. F, Time-frequency analysis of SD. PSD of SD calculated within sliding windows of 200 ms, for the same data as in A. G, Similar time-frequency analysis of LFP data of response to a high contrast drifting grating in awake macaque V1 (Xing et al., 2012). The black horizontal bars mark the peak frequency and the duration of each LFP gamma band burst as calculated by Xing et al. (2012).
