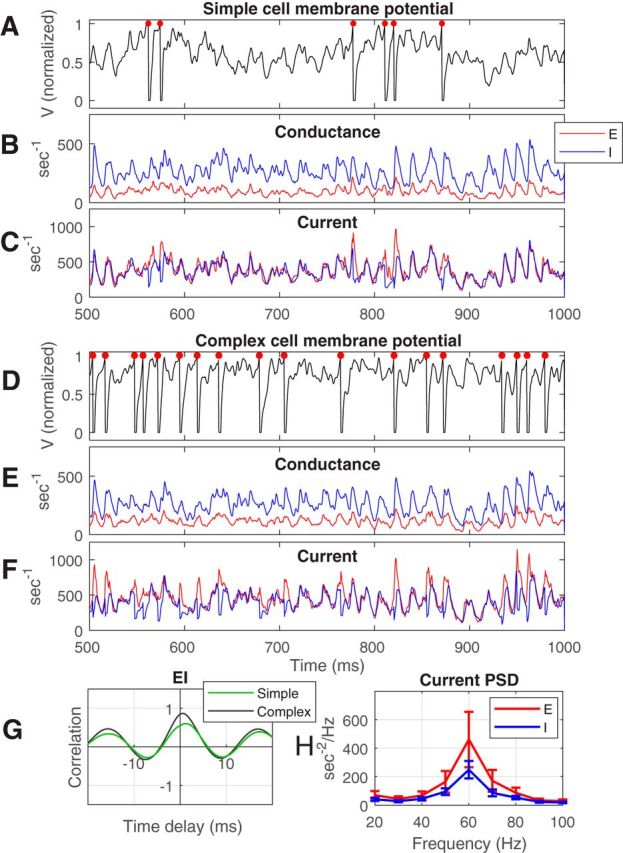
Figure 2.

Intracellular voltages and conductances of visually driven E- and I-cells in the CSY model. A, Membrane potential of a model simple cell that is part of the population in Figure 1A, driven by an optimal stimulus. B, C, Membrane conductance and currents, respectively, for the same simple cell. D–F, Corresponding plots (voltage, conductance, current) for a complex E-cell. E-conductance is drawn in red and I-conductance in blue. Notice that E- and I-currents are almost balanced almost all the time. G, Cross-correlation between the E- and I-currents in F and C, respectively. H, Average PSD of the E and I currents of 32 randomly chosen simple cells and 32 complex cells in the same population as in Figure 1A. PSDs were computed for each cell and the PSDs were averaged. Error bars mark 1 standard deviation.
