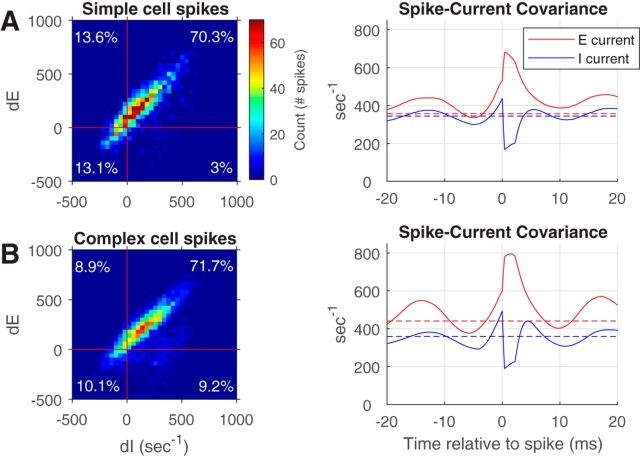
Figure 3.
2-D histograms and spike-current cross-covariances for simple and complex E-cells. A, Left, 2-D histogram of the change in the E- and I-currents in the 5 ms preceding a spike for randomly chosen simple cells in a local population. The percentage of spikes with dE and dI both positive preceding a spike is indicated in the top right corner as 70.3%. The percentage of spikes that had dE and dI both negative preceding a spike is written in the bottom left corner as 13.1%. Right, Spike-current covariance for the same simple cell population confirms that the average E-current and I-current were both increasing before the occurrence of a spike. A and B, Dashed horizontal lines are plots of the spike-current covariance when spike times are placed randomly in time; they indicate a baseline for the covariance. The abrupt jump up in E-current and the abrupt downswing in I-current at t = 0 in the spike-current covariance plots is a consequence of the integrate-and-fire mechanism used in the model. After a spike, the membrane potential is reset to 0, suddenly changing the driving force for E- and I-current. B, These are the corresponding plots for a population of complex cells. The maximum standard deviation of the covariances was ±40 s−1.

