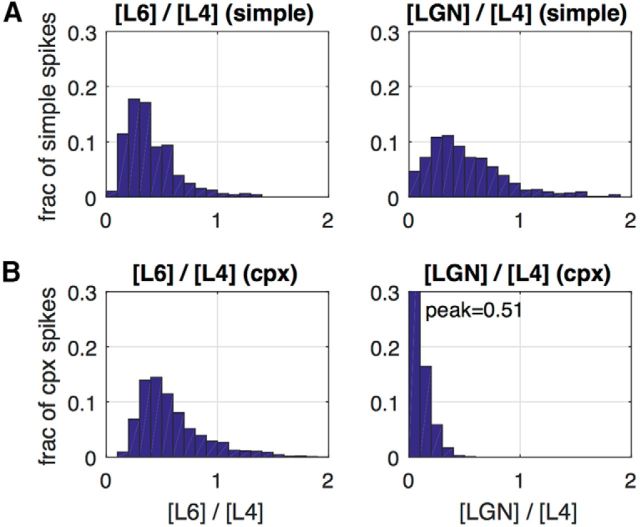
Figure 5.
Contributions of different sources of excitatory current to spike-firing in model E-cells; population histograms. Components of excitatory current in the 5 ms interval preceding each spike. A, Simple cells. B, Complex cells. Left, The distribution of the ratio of layer 6 to layer 4 current across the population of neurons in the E-cell population. Plotted is the fraction of spikes with a particular layer 6–layer 4 ratio. The mean value for simple E-cells of the L6/L4 distribution was 0.41 ± 0.02. For complex cells, the mean L6–L4 ratio was 0.59 ± 0.02. Right, The distribution of the ratio of LGN to layer 4 current across the population of neurons in the E-cell population. Plotted is the fraction of spikes with a particular LGN–layer 4 ratio. For simple cells, the mean LGN–L4 ratio was 0.59 ± 0.03, whereas for complex cells it was 0.08 ± 0.003.

