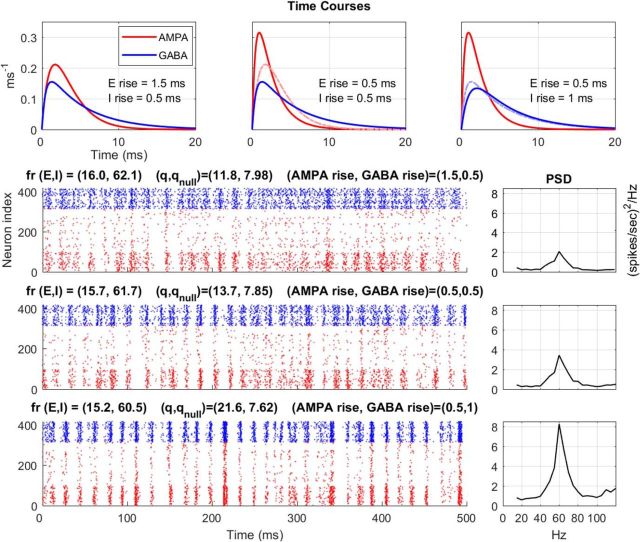
Figure 6.
Conductance dynamics effects on synchrony and PSD in model cortex. In the top row are drawn the relative rise times of E (AMPA) and I (GABA) conductances in three different regimes, three different cortical states as it were. Below the conductance plots are three rows of rasters with their corresponding PSDs. The left, middle, and right conductance plots correspond to the top, middle, and bottom rasters, respectively. Each raster depicts the spiking of 400 neurons within an orientation domain when the model cortex is stimulated by a drifting grating in the optimal orientation for the domain. As before, red dots stand for E-cell spikes; blue dots stand for I-cell spikes. Vertical axis of the raster is cell index. Above each raster are written the mean firing rates for E- and I-cells, and the synchrony measures (q values; see Materials and Methods) for each condition. What are varied from raster to raster are the rise times of E and I; all other parameters are identical. The middle raster is for the CSY model; its rise times for both E and I are 0.5 ms. Compared with the middle row, E rise time in the top row is slowed down by 1 ms, and I rise time in the bottom row is slowed down by 0.5 ms. These small differences in rise times (dashed lines in each conductance plot showing what was changed from the previous one) led to the marked changes in synchrony and sizes of PSD peaks. The synchrony index ratio (q/qnull) for each of the three rasters was 1.47 ± 0.01, 1.77 ± 0.02, and 2.87 ± 0.03, respectively, from top to bottom. The PSD peaks had standard deviations, respectively, from top to bottom of ±0.09, 0.14, and 0.46 (spikes/s)2/Hz.

