
Figure 8.
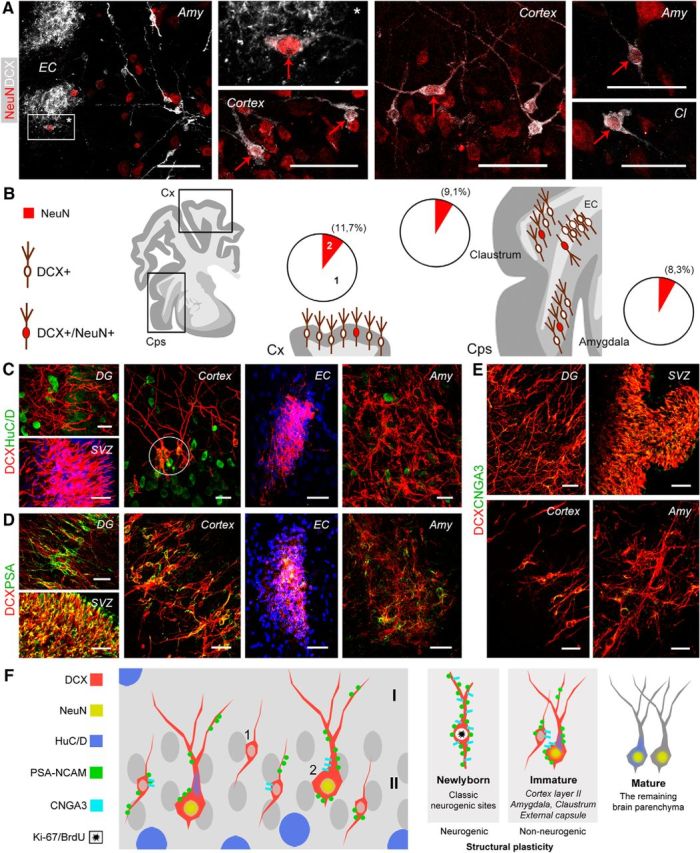
Markers of neuronal maturity/immaturity in DCX+ cells of the adult (A, B, D) and young (C, E) sheep brain. A, Double staining for DCX and NeuN (red arrows) in different brain regions. EC, External capsule; Amy, amygdala; Cl, claustrum. B, Both in cortical (Cx) and in capsular/pericapsular regions (Cps), the DCX+/NeuN+ cells represent a small subpopulation of all DCX+ cells (red areas in pie charts); 1 and 2 in cortex pie chart refer to type 1/type 2 cells (Fig. 2). C, Marker of initial differentiation and maturity HuC/D is not detectable in the neurogenic sites (DG, dentate gyrus; SVZ, subventricular zone) and mostly absent in DCX+ immature neurons apart from a weak expression in some type 2 cells of the cortical layer II (circle). D, Double staining with the marker of immaturity PSA-NCAM reveals all DCX+ cells largely decorated in the neurogenic zones (DG and SVZ), whereas only subpopulations of DCX+ cells are partially stained in the cortical and subcortical regions. E, Similarly to PSA-NCAM, the A3 subunit of the cyclic nucleotide-gated ion channel (CNGA3) is detectable in most DCX+ cells of the neurogenic sites and in subpopulations of DCX+ cells in other brain regions. F, Schematic summary of maturity/immaturity features in DCX+ cells of the sheep as revealed by different cellular markers (showed for the cortex but representative of all regions investigated). Scale bars, 30 μm.