Figure 10.

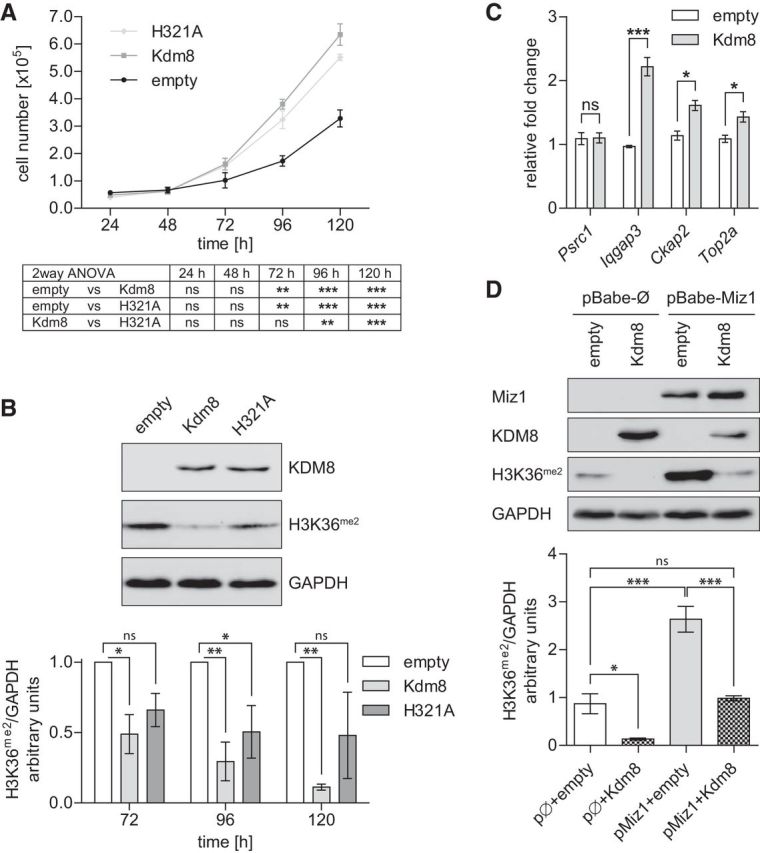
Kdm8 promotes mSC80 Schwann cell proliferation likely through H3K36 demethylation. A, Amido black assay for cell-number quantification of mSC80 Schwann cells at indicated times after transfection with empty, Kdm8, or KDM8H321A plasmids. Results of a two-way ANOVA statistical analysis followed by a Bonferroni's post-tests are depicted in the table below. n = 4 individual experiments. B, Representative Western blot of Kdm8 (detected by a Myc-Tag antibody) and H3K36me2 protein levels in mSC80 cell homogenates 72 h after transfection with the indicated plasmids (top). Signal intensity quantification of H3K36me2 at indicated times after transfection (bottom). n = 4 (72 h), 3 (96 h), and 2 (120 h) individual experiments. Statistical test: two-way ANOVA, followed by Bonferroni's post-tests. C, Gene expression analysis of cycle-associated genes shown to be differentially methylated in Miz1ΔPOZ mice (Fig. 8D) relative to Gapdh using qRT-PCR analysis on RNA from mSC80 cells 72 h after transfection with empty or Kdm8 plasmids. One of two independent experiments is shown using n = 3 replicates per condition in each experiment. D, Representative Western blot stained for Miz1, Kdm8 (Myc-Tag) and H3K36me2 72 h after transfection of stably Miz1 or empty pBabe vector-expressing mSC80 Schwann cells with another empty or Kdm8 vector (top). Signal-intensity quantification of H3K36me2 of n = 3 independent experiments is presented at the bottom. Statistical test: one-way ANOVA, followed by Tukey's multiple-comparison post test. A and B Asterisks indicate the results of a two-way ANOVA statistical analysis followed by a Bonferroni's post-test C, Asterisks indicate the results of a two-tailed, unpaired Student's t-test. D, Statistical test: one-way ANOVA, followed by Tukey's multiple comparisonpost test (*p < 0.05, **p < 0.01, ***p < 0.001; ns = not significant).
