Figure 3.

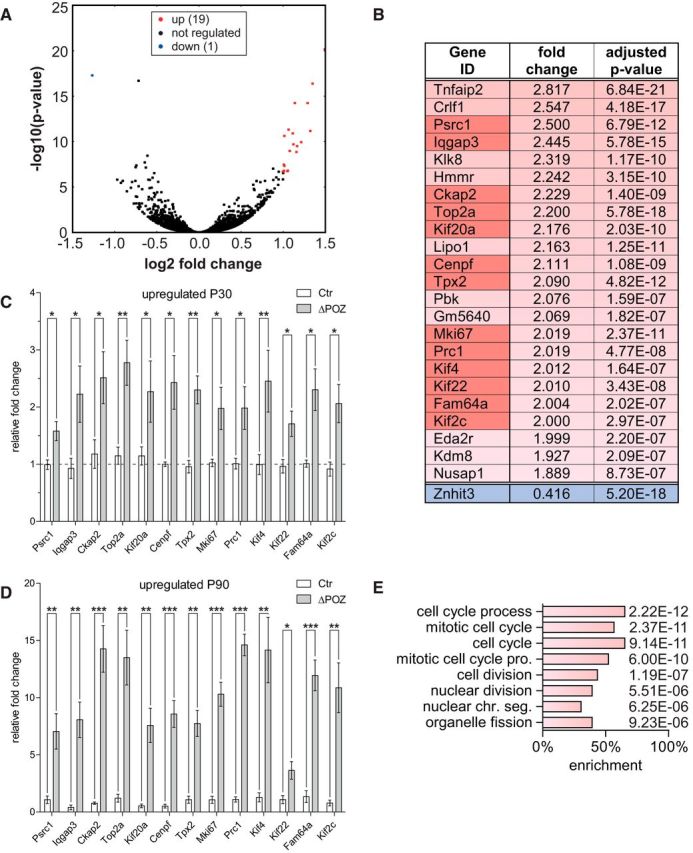
Identification of an early upregulated gene set implicated in cell division using RNA sequencing. A, Volcano plot representing the fold change (FC) and false discovery rate-adjusted p value of all 19,459 considered genes in an RNA sequencing analysis conducted on P30 control (Ctr; n = 5) and Miz1ΔPOZ (n = 3) sciatic nerves, highlighting twofold (false discovery rate, <10−6) regulated genes in red (up) or blue (down). B, List of almost twofold deregulated genes that also have a highly significant false discovery rate of <10−6. C–D, Gene-expression analysis relative to Gapdh, validating a set of deregulated genes (dark red in B) by qRT-PCR analysis at P30 (C) or P90 (D) in Ctr and Miz1ΔPOZ sciatic nerves; n = 4 animals per genotype and time point. E, GO analysis of the deregulated gene list depicted in B representing all biological processes with p < 10−5. C and D, Asterisks indicate the results of a two-tailed, unpaired Student's t-test (*p < 0.05, **p < 0.01, ***p < 0.001).
