Figure 5.

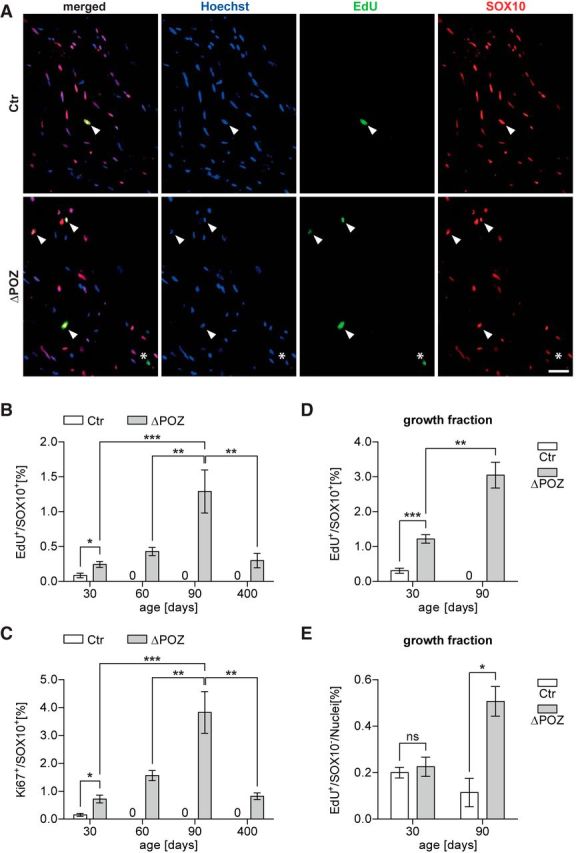
Sustained proliferation in Miz1ΔPOZ sciatic-nerve Schwann cells. A, Control (Ctr) and Miz1ΔPOZ mice were intraperitoneally injected once with EdU and killed 1 h later. Longitudinal sections of P30 sciatic-nerve samples were costained for incorporated cell-cycle marker EdU (green) and Schwann cell marker Sox10 (red). Nuclei were counterstained using Hoechst. Arrowheads denote double-positive cells. Asterisk marks a proliferating EdU-positive, but Sox10-negative, non-Schwann cell. Scale bar, 50 μm. B, Labeling index representing the percentage of Schwann cells in the cell cycle at the time of injection (EdU+ and Sox10+) among all Schwann cells (Sox10+) in Ctr and Miz1ΔPOZ mice of indicated ages. C, Quantification of the percentage of Ki67-positive Schwann cells (Sox10+) in Ctr and Miz1ΔPOZ mice of indicated ages. n = 3–5 nerves per genotype and time point; counted nuclei per nerve: 250–700. D, E, Ctr and Miz1ΔPOZ mice at indicated ages were intraperitoneally injected seven times with EdU within 16 h and longitudinal sciatic-nerve sections were immunostained as in A. D, E, The growth fraction was determined as the percentage of all EdU+ cells during this period for Sox10+ Schwann cells (D) or cells of other origins (Sox10−, E). n = 3–4 sciatic nerves per genotype; counted nuclei per nerve: 1500–3000 at P30, 1100–1800 at P90. B, C, One-way ANOVA, followed by Tukey's multiple-comparison post-test for statistical comparison among P30, P60, and P90 Miz1ΔPOZ mice. D and E Asterixs indicate the results of a two-tailed, unpaired Student's t-test (*p < 0.05, **p < 0.01, ***p < 0.001; ns = not significant; p > 0.05).
