Figure 8.

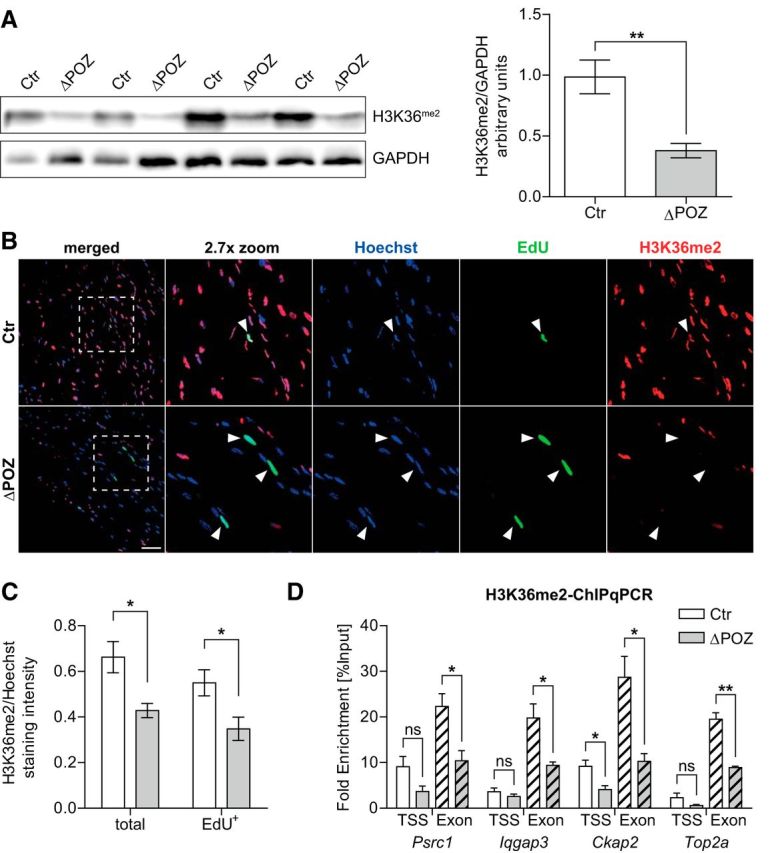
Decreased H3K36me2 level in Miz1ΔPOZ correlates with sustained proliferation. A, Western blot analysis of H3K36me2 in sciatic-nerve homogenates from P30 control (Ctr) and P30 Miz1ΔPOZ mice and subsequent signal-intensity quantification in relation to Gapdh (right); n = 4 mice for each genotype. B, P30 Ctr and Miz1ΔPOZ animals were intraperitoneally injected seven times with EdU within 16 h for growth-fraction analysis (Fig. 4E). Confocal images were taken of longitudinal sciatic-nerve sections simultaneously stained for EdU (green) and H3K36me2 (red), maintaining the same image-acquisition settings. Dashed boxes highlight magnified regions. Arrowheads, EdU-stained nuclei. Scale bar, 50 μm. C, Corresponding staining-intensity quantification of confocal images representing the average H3K36me2 intensity per area in relation to the average Hoechst signal of the same area for all nuclei (total) or only for EdU-positive nuclei (EdU+). n = 4 mice per genotype; analyzed nuclei: ≥1000 per sample. D, In vivo ChIP-qPCR analysis conducted on chromatin isolated from pooled sciatic nerves of 10 P30 Ctr or Miz1ΔPOZ mice using an H3K36me2 antibody and primers spanning a region close to the TSS or a coding region at the 3′ end of the indicated genes. For most genes and regions, an average fold enrichment compared with an unspecific IgG control >100, but at least 20 confirmed specificity in each experiment (data not shown). n = 3 independent experiments. A, C and D Asterisks indicate the results of a two-tailed, unpaired Student's t-test (*p < 0.05, **p < 0.01; ns = not significant).
