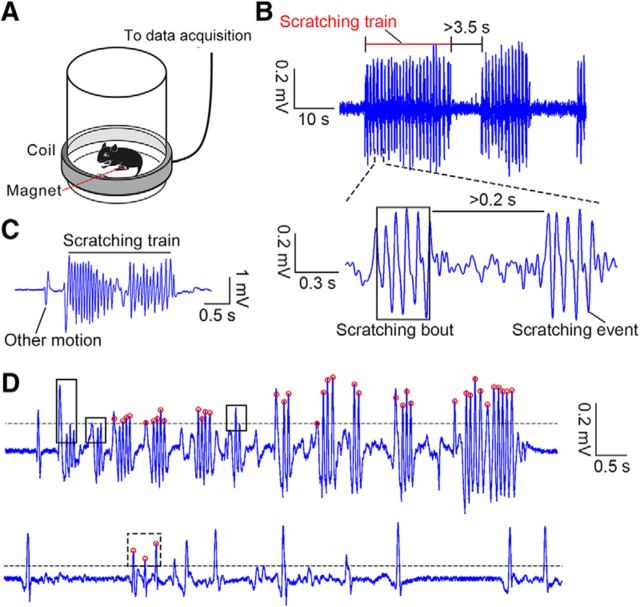
Figure 1.
Recording and definition of scratching behavior. A, Schematic of the recording of scratching behavior. B, Example voltage trace including scratching behavior. Top, A 60 s trace; bottom, a 1.7 s trace, including two scratching bouts. C, Example behavioral trace with scratching behavior and other motion events. D, Top, example trace showing missed scratching bouts after autocalculation by a custom-written code. The black line indicates the threshold used to identify the voltage peaks. The red circle indicates right voltage peaks related to scratching. The black boxes indicate three missed scratching bouts. Bottom, Example trace showing a false identified scratching bout, indicated by the dashed black box.

