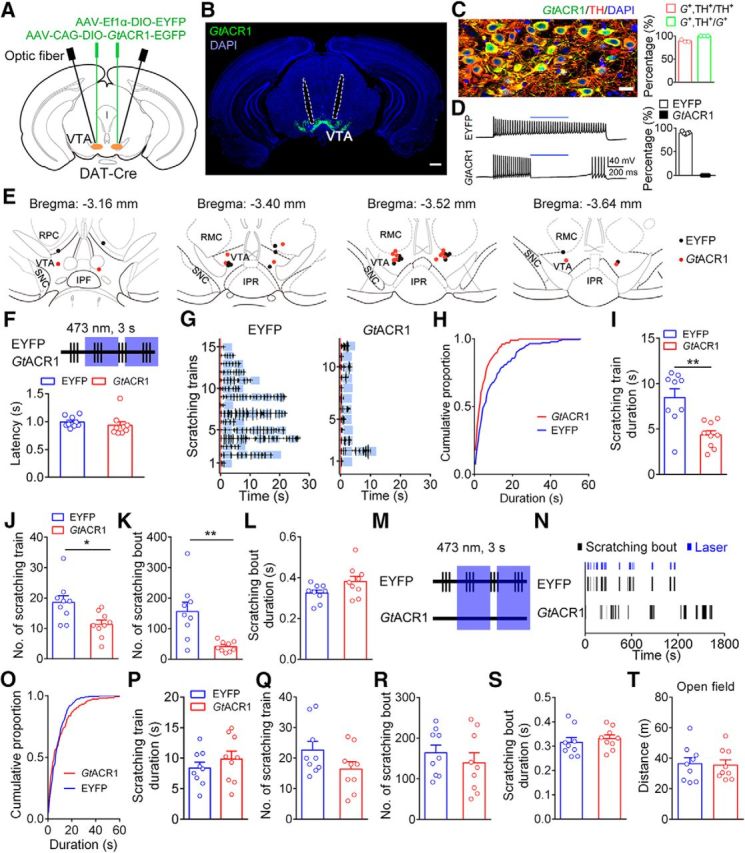
Figure 5.

Optogenetic inhibition of VTA DA neurons attenuated chloroquine-induced scratching behavior. A, Schematic of virus injection and optic fiber implantation. B, Representative image illustrating GtACR1 expression and optic fiber track (outlined by dashed lines). Scale bar, 500 μm. C, Specificity of GtACR1 expression. Left, Representative confocal image showing the expression of GtACR1 and TH in the VTA. Scale bar, 20 μm. Right, Percentage of neurons labeled with GtACR1 and TH (511 GtACR1+ neurons and 574 TH+ neurons in 3 mice). G+, GtACR1+. D, Left, Response of a representative EYFP+ neuron (top) and a representative GtACR1+ neuron (bottom) to 473 nm light stimulation. Blue bars indicate 0.5 s of 473 nm. Right, Percentage of the firing rates of neurons during the light-on period relative to the baseline period (n = 6 GtACR1+ neurons; n = 5 EYFP+ neurons). E, Histological verification of optic fiber tips. F, Schematic showing transient light delivery to each VTADA-EYFP or VTADA-GtACR1 mouse after scratching onset. Top, Schematic of laser delivery pattern: vertical bar, scratching event; blue area, 3 s of 473 nm light delivery. Bottom, Laser delivery latency relative to the scratching train onset (n = 9 mice/group). G, Scratching train traces in representative VTADA-EYFP (left) and VTADA-GtACR1 (right) mice. Blue area, Light-delivery period; red line, onset of scratching train. H, Cumulative proportion of the duration of scratching trains in the EYFP and GtACR1 groups. I, Effect of the transient inhibition of DA neurons on scratching train duration (unpaired two-sided t test, t(16) = 3.81, **p = 0.0015). J, Total number of scratching trains was significantly decreased following the inhibition of DA neurons after the scratching onset (unpaired two-sided t test, t(16) = 2.77, *p = 0.0136). K, Total number of scratching bouts was significantly decreased (unpaired two-sided t test, t(16) = 3.69, **p = 0.002). L, Average scratching bout duration was unaffected by the transient inhibition (unpaired two-sided t test, t(16) = 1.94, p = 0.0697). M, Schematic showing the pseudorandom transient light delivery to paired VTADA-EYFP and VTADA-GtACR1 mice after the VTADA-EYFP mice started to scratch. N, Raster plot of scratching bouts in a representative pair of VTADA-EYFP and VTADA-GtACR1 mice in a pseudorandom inhibition pattern. O, Cumulative proportion of the duration of scratching trains in the EYFP and GtACR1 groups in a pseudorandom inhibition pattern. P, Effect of pseudorandom transient inhibition of DA neurons on scratching train duration (unpaired two-sided t test, t(16) = 0.94, p = 0.3614). Q, Total number of scratching trains did not significantly differ between the two groups following the pseudorandom transient inhibition (unpaired two-sided t test, t(16) = 1.67, p = 0.1145). R, Effect of pseudorandom transient inhibition of DA neurons on scratching bout number (unpaired two-sided t test, t(16) = 0.80, p = 0.4378). S, The average scratching bout duration did not significantly differ between the two groups following the pseudorandom transient inhibition (unpaired two-sided t test, t(16) = 0.63, p = 0.5385). T, Transient inhibition of DA neurons by optogenetics did not change the traveled distance of the mice in an open field test (n = 9 mice/group; unpaired two-sided t test, t(16) = 0.19, p = 0.8535). The data are expressed as the mean ± SEM.
