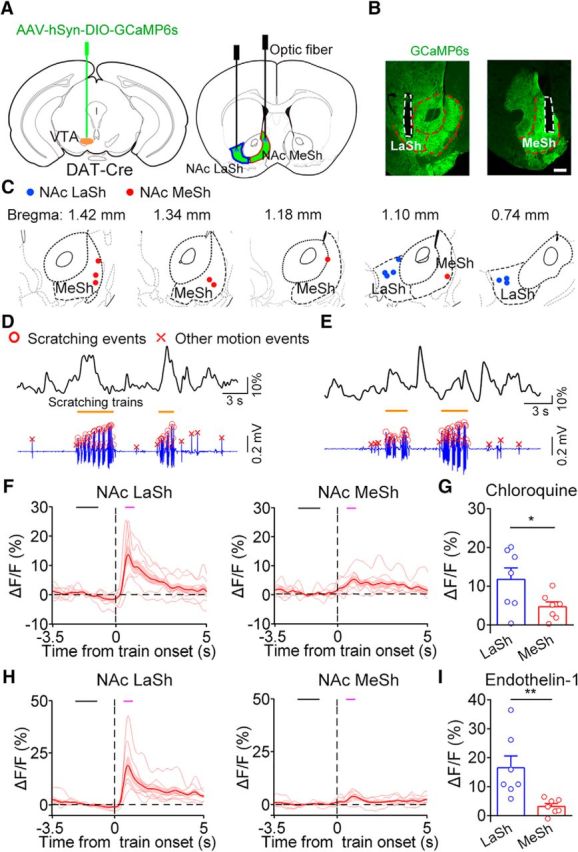
Figure 6.

Activity of DA fibers in the NAc during itch-induced scratching behavior. A, Schematic of virus injection and optic fiber implantation for recording DA projection activity in the NAc with fiber photometry. B, GCaMP6s expression and representative fiber-optic tracks in each group. Scale bar, 300 μm. C, Histological verification of the location of optic fiber tips for all animals in the LaSh group (n = 7) and the MeSh group (n = 7). D, Representative DA projection fluorescence change in the NAc LaSh (top) and the behavioral trace (bottom) recorded simultaneously in response to an intradermal injection of chloroquine. E, Representative DA projection fluorescence change in the NAc MeSh and the behavioral trace recorded simultaneously in response to an intradermal injection of chloroquine. F, Average fluorescence change in the LaSh group (left, n = 7 mice) and in the MeSh group (right, n = 7 mice) for the chloroquine model. The black bar indicates the baseline period (−2.2 to −1 s) used for the quantification analysis. The magenta bar indicates the scratching train onset period (0.5–1 s). G, Comparison of the average GCaMP6s fluorescence change between the two groups during the onset period in the chloroquine model (unpaired two-sided t test, t(12) = 2.22, *p = 0.0467). H, Average fluorescence change in the LaSh (left) and the MeSh (right) groups for the endothelin-1 model (n = 7 mice in each group). I, Comparison of the average GCaMP6s fluorescence change between the two groups during the onset period in the endothelin-1 model (unpaired two-sided t test, t(12) = 3.11, **p = 0.009). The data are expressed as the mean ± SEM.
